
Scatterplot
Points on two axes that show how two measures relate.
The idea
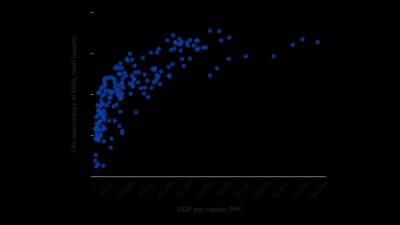
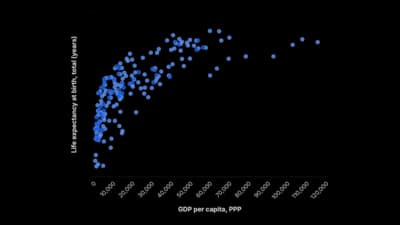
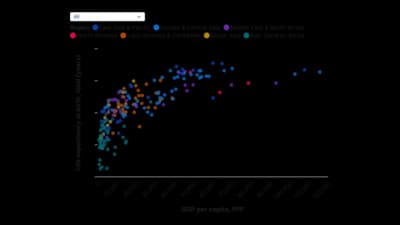
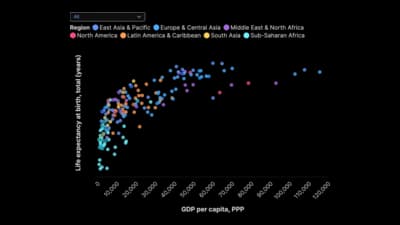
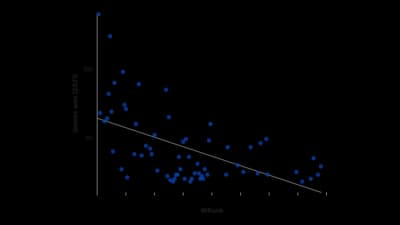
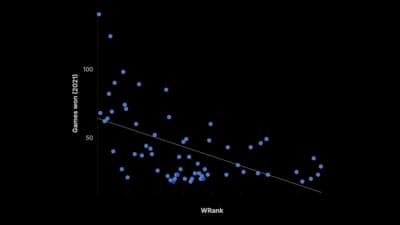
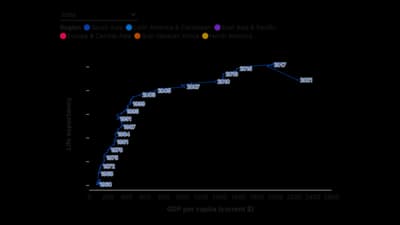
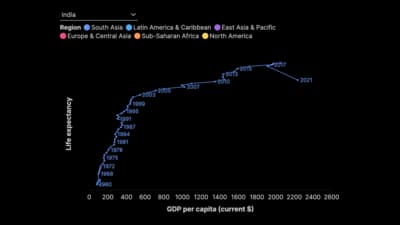
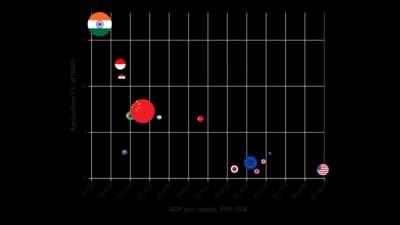
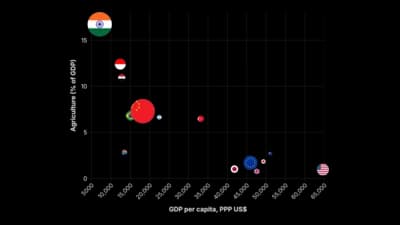
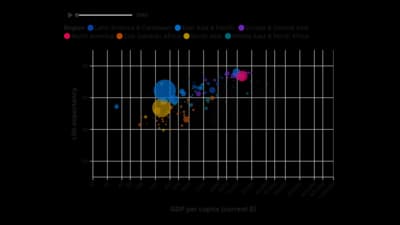
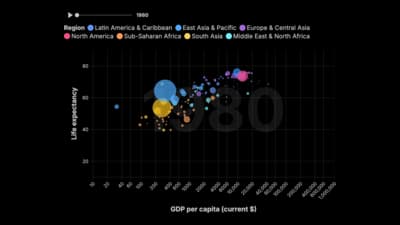
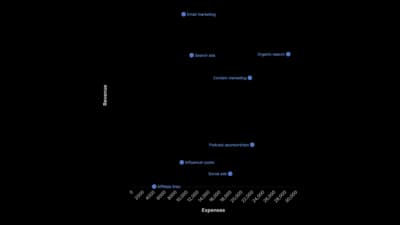
A scatterplot plots one measure against another, so each point is a thing placed by two values. It reveals correlation, clusters and outliers that tables hide. Add a trendline to show the direction and label the points readers will ask about.
Where to use it
- Testing whether two measures move together
- Positioning items on two axes, such as cost against value
- Spotting outliers and clusters
- Animated change in the relationship over time
Templates
Start from any of these templates and swap in your own data.

Ready to Transform Your Data Storytelling?
Join +6,000 creating stunning charts and video visuals with the all-in-one AI data visualization platform.
PlotSet helps data analysts, marketers, and designers transform complex data into clear, compelling stories. start creating today.