
Bar Chart
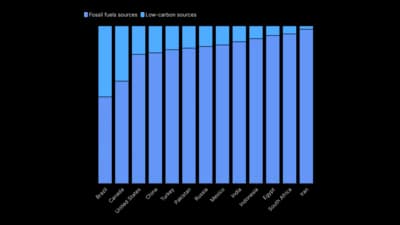
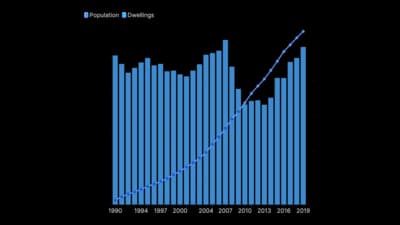
Bars and columns that compare sizes across categories.
The idea
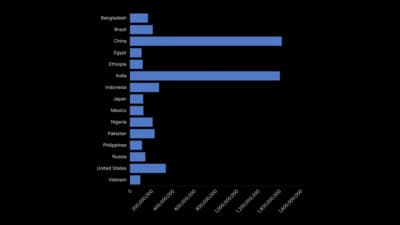
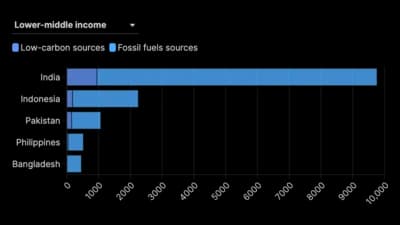
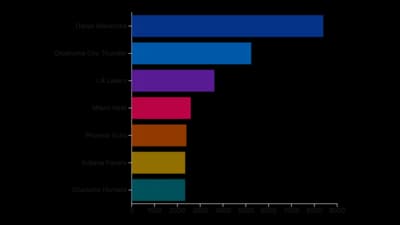
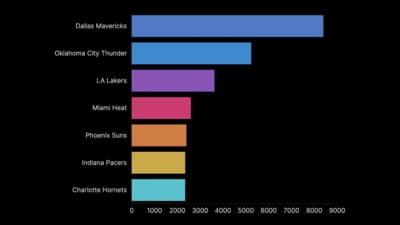
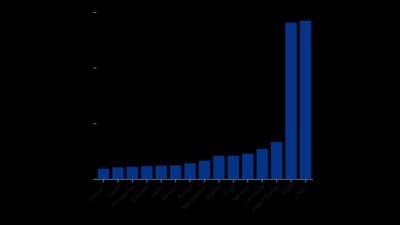
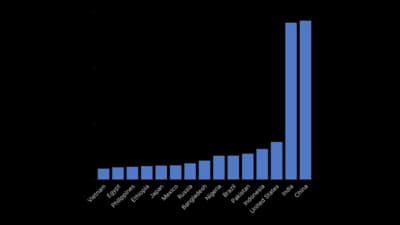
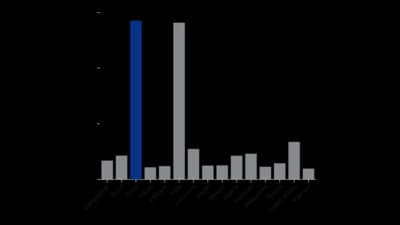
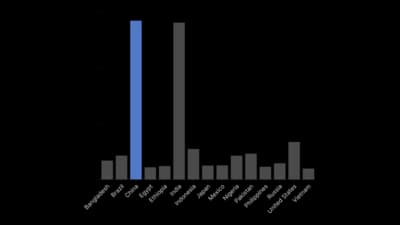
A bar chart compares values by the length of a bar along a shared baseline, the most accurate thing people read in any chart. Use horizontal bars for long labels and columns for time or a few categories. Sort the bars so the ranking reads at a glance.
Where to use it
- Comparing sales, votes or answers across categories
- Rankings of countries, brands or products
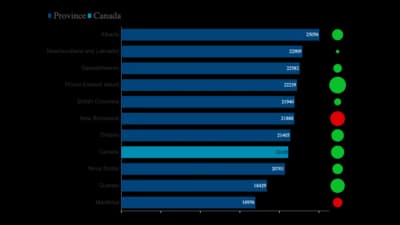
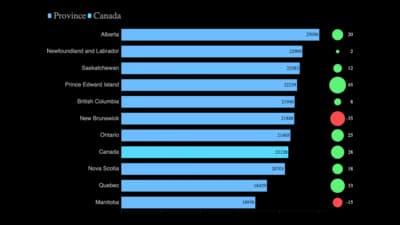
- Change against last period with an indicator
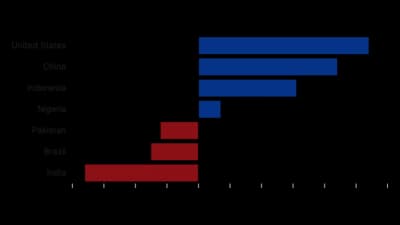
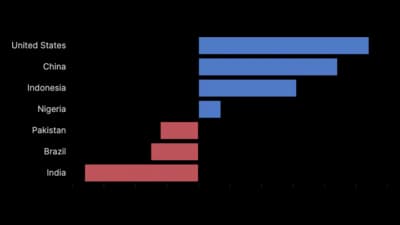
- Positive and negative values around a centre line
Templates
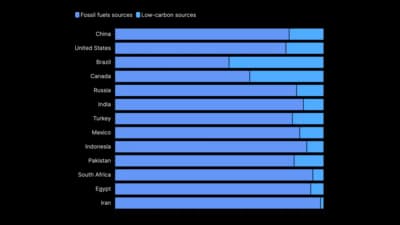
Start from any of these templates and swap in your own data.
Ready to Transform Your Data Storytelling?
Join +6,000 creating stunning charts and video visuals with the all-in-one AI data visualization platform.
PlotSet helps data analysts, marketers, and designers transform complex data into clear, compelling stories. start creating today.