
示例 CSV
| Quarter | North America | Europe | APAC |
|---|---|---|---|
| 2023-Q1 | 182000 | 146000 | 98000 |
| 2023-Q2 | 191000 | 151000 | 104000 |
| 2023-Q3 | 205000 | 158000 | 112000 |
| 2023-Q4 | 224000 | 167000 | 121000 |
| 2024-Q1 | 218000 | 171000 | 129000 |
| 2024-Q2 | 233000 | 179000 | 138000 |
A step by step walkthrough for turning a spreadsheet of dates and numbers into a published line chart in PlotSet, from shaping the sheet to exporting or embedding the finished trend.
约 8 分钟This is how to create a line chart in PlotSet that actually reads as a trend and not just a wiggly shape: your own dates in the first column, one or more series after it, styled and published the same way any real chart goes out. By the end you will have taken one time series from a raw spreadsheet to a published, embeddable chart with hover tooltips, not a copy of someone else's example with your numbers swapped in.
If your sheet already has one date column and one or two number columns in order, this takes about eight minutes. Add another five if you are converting a wide report, one column per month, into the long, one-row-per-period shape a line chart wants, or if you need to decide how a genuine gap in the series should be handled before you upload.
One row per time period, already in chronological order: the date or period label first, then one numeric column for each line you want on the chart.
| Quarter | North America | Europe | APAC |
|---|---|---|---|
| 2023-Q1 | 182000 | 146000 | 98000 |
| 2023-Q2 | 191000 | 151000 | 104000 |
| 2023-Q3 | 205000 | 158000 | 112000 |
| 2023-Q4 | 224000 | 167000 | 121000 |
| 2024-Q1 | 218000 | 171000 | 129000 |
| 2024-Q2 | 233000 | 179000 | 138000 |
Keep the time column consistent: real dates, or a fixed label pattern like "2024-Q1" throughout. A column that mixes "Q1 2024" with "01/2024" sorts as text, not as time, and the axis will follow whatever order the rows happen to be in.
One numeric column per line. Three columns of regional revenue, like the sample above, become three lines with no extra configuration once they are mapped.
Rows must already be sorted oldest to newest before you upload. PlotSet draws the time axis in row order, it does not resort a date column for you.
Leave a cell blank for a period a series genuinely has no reading for. A blank draws as a gap in that one line rather than dropping to zero, which is usually what you want; fill it in if it is simply a missing entry, not an absence.
PlotSet 中从空白模板到完成图表的具体点击路径。
From the PlotSet dashboard, start a new project and choose the Line Chart template. It loads with sample data already bound to it, so you can see the exact column layout, one date column followed by one or more series columns, before you touch your own file.

Put your date or period in the first column, in order, and one number column per line after it. If your source is a wide report with a column per month, transpose it first: the upload needs one row per period, not one column per period.
Use the data panel to import a CSV or .xlsx file, paste rows straight from a spreadsheet, or connect a Google Sheet if you want the chart to pick up new periods later without a re-upload. PlotSet reads the first row as your column headers.

Tell PlotSet which column is the time axis and check that every numeric column you meant to plot is picked up as a series. This is usually automatic with clean headers, but worth a manual check if your sheet carries an extra column, like a running total, you don't want plotted.

Turn on end-of-line labels so each series name sits at the end of its own line instead of in a separate legend box. On anything with more than one line, this removes the colour-matching step entirely and is the single biggest readability change you can make.
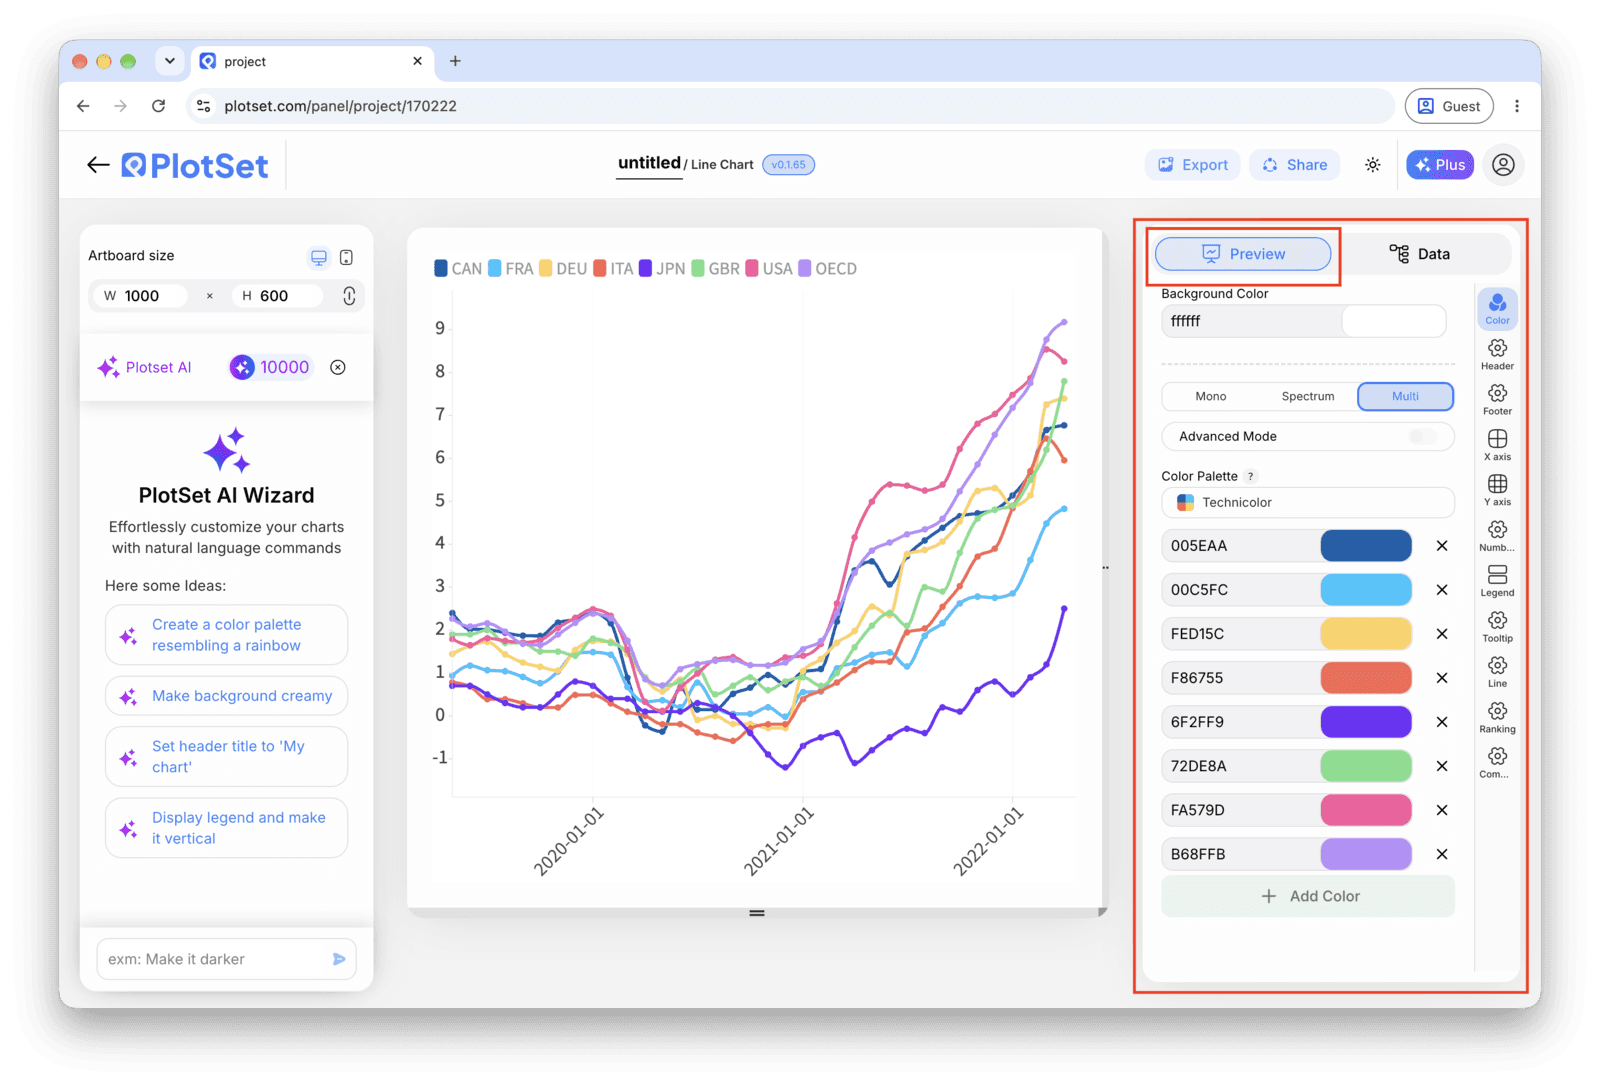
Decide whether the axis should start at zero or zoom into the range where the real movement happens. A line chart does not need a zero baseline the way a bar chart does, so pick a range that reflects the actual variation and say so if you are deliberately zooming in.
With monthly or quarterly data, individual point markers and background gridlines usually just add clutter to a shape that is already clear. Turn markers on only if readings are infrequent enough that each one is worth calling out on its own.
Publish for a live, interactive chart with hover tooltips and a shareable link, grab the embed code for a page, or export a PNG, SVG or PDF if you need a static image for a deck or report.
从已加载示例数据的 Line Chart 模板开始,再替换成你自己的数据。
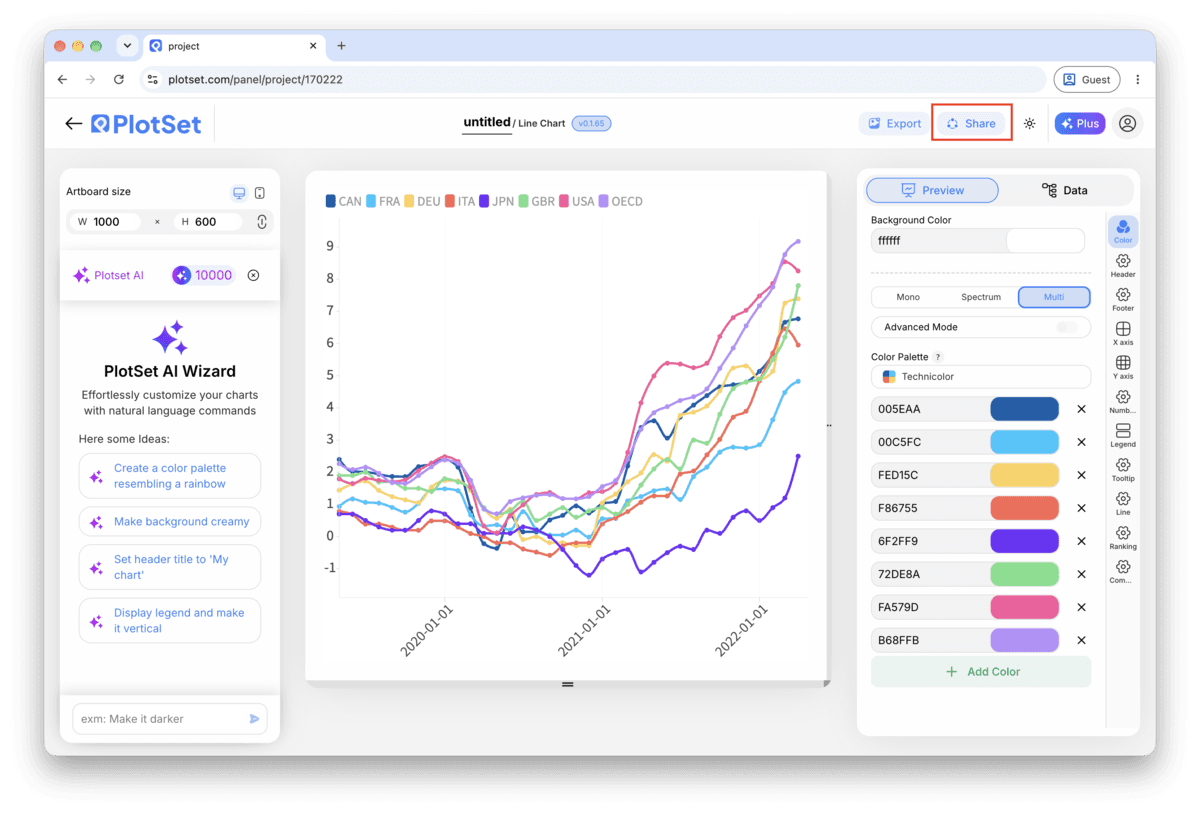
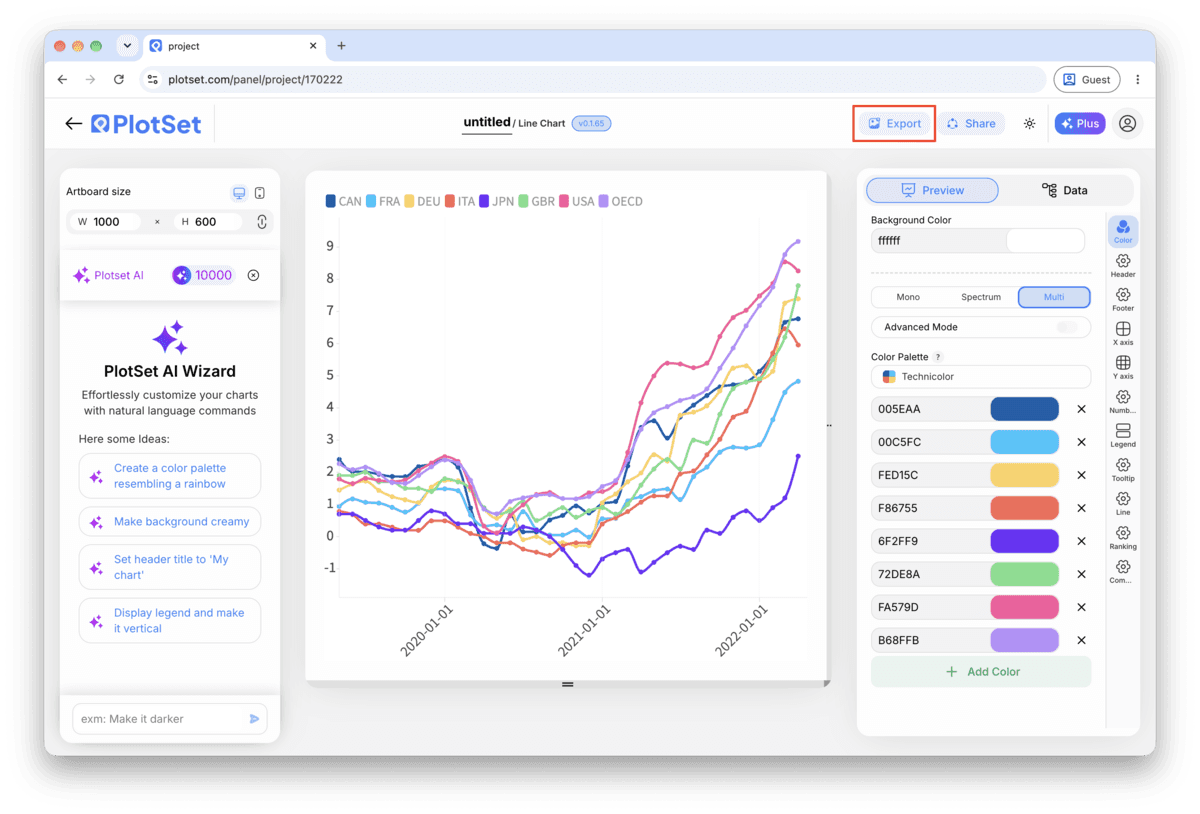
打开模板最后一段路对每种图表都一样:「Share」(分享)把图表变成一个在线的公开链接和一段嵌入代码,「Export」(导出)把它输出成静态文件。
打开嵌入代码和公开链接的开关,图表就发布出去了。链接可以放心发给任何人;嵌入代码以 iframe 的形式放进任意页面,悬停提示和交互效果都会保留。之后修改了图表,点「Recreate」就能把改动同步到链接和嵌入代码两边。

「Export」会按你需要的尺寸输出一份静态副本。SVG 放到多大都清晰,还能在设计工具里继续编辑;幻灯片和文档用 PNG 或 JPG 最稳妥。想让图片在高分屏上够锐利,关键就是那个倍数设置。

Once you have more than one line, a legend forces the reader to match colours between a box and the chart. A label at the end of each line answers the question before it gets asked, and it scales fine down to about five series.
Past roughly five series a line chart turns into a tangle nobody can trace. If you genuinely have more, either build small multiples, one line per small chart on shared axes, or colour the one line that matters and grey out the rest.
Revenue in dollars and a percentage plotted on the same vertical scale will squash one of them flat. If you need to compare series in different units, index them to a common starting point (100 at the first period, for instance) or put them on separate charts.
If a series is missing a reading for one period, leave that cell blank so PlotSet breaks the line rather than drawing a straight guess across the gap. Curve smoothing is worth avoiding for the same reason: it can invent a peak or a dip between two points that were never actually measured.
This almost always means the source rows are not sorted chronologically before upload, so PlotSet is drawing the axis in whatever order the sheet happened to have. Sort the time column oldest to newest in your spreadsheet and re-upload.
Check whether the two series are actually in the same unit. A series in the thousands plotted against one in single digits, or dollars against a percentage, will always compress the smaller one to a flat line near zero. Normalise both to a common scale or split them into separate charts.
That happens when the missing cell was filled with a zero or an average instead of left blank. Clear the cell in the source sheet so it is genuinely empty, then re-upload: PlotSet will break the line there instead of drawing a fake slope across it.
不确定 Line Chart 是否是正确选择?查看它是什么、何时使用以及何时不使用。
One row per time period, sorted oldest to newest, with the date or period label in the first column and one numeric column for each line you want. CSV, .xlsx and a pasted spreadsheet range all work, as long as the time column stays in one consistent format.
免费开始,300+ 模板任选。无需信用卡。