PlotSet LogoPlotSet

How to Create a Treemap

A step by step walkthrough for turning a spreadsheet into a published treemap in PlotSet, from shaping the category and parent columns to exporting or embedding the finished tiles.

Cerca de 8 minutos

This is how to create a treemap in PlotSet from your own spreadsheet: tiles sized by value, grouped by hierarchy, coloured on purpose, then published as a live embed or exported as an image. Your own rows go through the same upload-to-publish path a real PlotSet treemap takes, including the one column that trips people up: the parent.

If your spreadsheet already has a category, a parent and a value in three columns, eight minutes gets the whole thing done. Pulling the data out of a pivot table first adds another five, since pivot exports usually carry subtotal rows that need to come out before the tiles will size correctly.

Os dados que você precisa

Three columns, one row per tile: the category name, its parent group (blank for a top-level tile), and a positive number. One header row, no subtotal rows.

CSV de exemplo
CategoryParentRevenue
North America4200000
Europe3100000
Asia Pacific1800000
United StatesNorth America3300000
CanadaNorth America900000
GermanyEurope1400000
FranceEurope900000
United KingdomEurope800000
JapanAsia Pacific1100000
AustraliaAsia Pacific700000
Anotações

Leave the parent column blank for a top-level row, not filled with a placeholder like "None" or "Top". A blank cell is how PlotSet knows a tile has no ancestor; a text placeholder gets read as an actual parent name and adds a stray tile.

Every value must be zero or greater. A negative revenue or a loss row will not render as a tile, since a rectangle cannot have negative area, so pull those rows into a separate table before you upload.

If you are working from a pivot table, delete the grand total and subtotal rows first. A "Total" row uploaded alongside real categories becomes a tile of its own, usually the largest one on the page.

A flat treemap with no hierarchy works too: just leave the Parent column out entirely, or leave every cell in it blank, and every row becomes a top-level tile.

Parent names have to match a Category value exactly, including case and spacing. "north america" in the Parent column will not find "North America" in Category, and that child tile gets dropped.


Os passos

O caminho exato no PlotSet, de um modelo em branco até o gráfico finalizado.

  1. 01

    Open the treemap template

    From the PlotSet dashboard, start a new project and choose the Treemap template. It loads with sample data already bound, tiled by category, parent and value, so you can see the exact three-column shape before you swap in your own file.

    O seletor de modelos do PlotSet: as categorias de gráficos listadas à esquerda, a grade Bar Charts aberta e o card do modelo Bar Chart mostrando o botão Select.
    Todo guia começa aqui. Escolha a categoria e depois o modelo: a grade é a mesma, seja qual for o tipo de gráfico que você quer.
  2. 02

    Shape your sheet into category, parent and value

    One row per tile: its name, the group it sits inside, and its size. If your source is a pivot table or a finance report, pull those three fields out into a plain flat sheet first. No merged cells, no subtotal rows.

  3. 03

    Upload the sheet or connect a live one

    Use the data panel to import a CSV or .xlsx file, paste rows straight from a spreadsheet, or connect a Google Sheet so the treemap can be refreshed later without a re-upload. PlotSet reads the first row as headers.

    A visualização de dados do editor do PlotSet: uma planilha com as colunas Name, Value e Region preenchidas com números de províncias canadenses, ao lado do painel Data, que oferece envio de CSV, Magic Import e sincronização com o Google Sheet.
    A visualização de dados, aqui em um projeto de gráfico de barras. Envie um CSV, extraia os números de uma imagem com o Magic Import ou sincronize um Google Sheet. O painel é idêntico para todos os tipos de gráfico.
  4. 04

    Map the category, parent and value columns

    Confirm which column feeds the tile name, which one feeds the parent group, and which one sizes the tile. PlotSet usually guesses right when your headers are clear, but check it manually if your sheet has extra columns sitting between them.

    O painel Data do PlotSet com os vínculos de colunas em destaque: Label/time apontando para a coluna A, Values para a coluna B e Filter/color para a coluna C, com o botão Auto Binding logo abaixo.
    Os vínculos definem qual coluna vira o rótulo, qual fornece os valores e qual comanda a cor. O Auto Binding tenta adivinhá-los a partir dos seus cabeçalhos, então confira o resultado em vez de dar como certo.
  5. 05

    Check the hierarchy renders the way you expect

    Look for a top-level tile that is really a stray parent name, or a child tile that vanished because its parent value did not match exactly. Fix mismatches in the source sheet and re-upload rather than patching the chart by hand.

  6. 06

    Colour by group, not by size

    Size is already spoken for by the tile's area. Set the colour scale to the parent group so the hierarchy reads at a glance, or switch it to a second numeric column, growth rate or margin, if you want colour to carry a different story than area does.

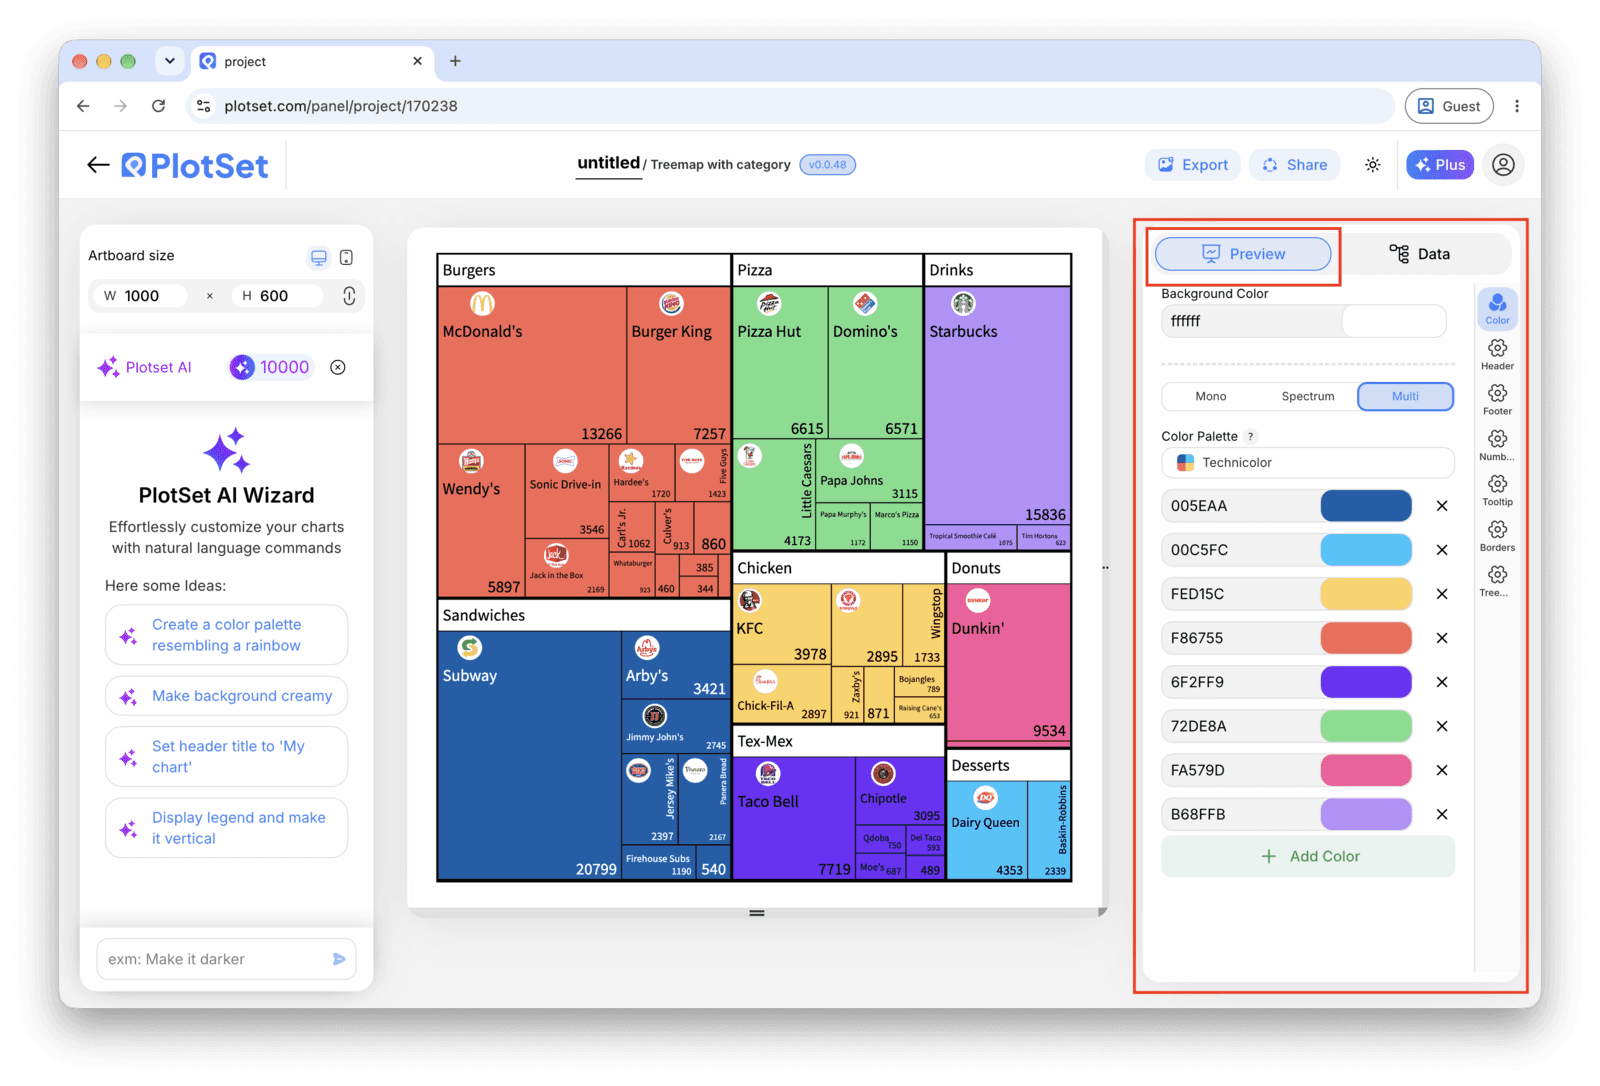
    O editor do PlotSet na aba Preview: um gráfico do tipo Treemap já finalizado na área de edição e, na lateral direita, o painel de configurações contornado em vermelho.
    A aba Preview de um gráfico do tipo Treemap. Todos os controles de estilo ficam no painel contornado em vermelho: aparência, cabeçalho, rodapé e as opções específicas desse tipo de gráfico. Cada grupo fica em sua própria aba.
  7. 07

    Turn on labels for the tiles big enough to hold them

    PlotSet hides labels automatically once a tile gets too small to fit text without overlapping its neighbours. Leave that behaviour on rather than forcing every tile to label, and rely on the hover tooltip to surface the exact value for the small ones.

  8. 08

    Publish, embed or export the tiles

    Publish for a live interactive treemap with hover tooltips and a shareable link, grab the embed code to drop it into a page, or export a PNG, SVG or PDF if you need a static image for a deck or a report.

Comece pelo modelo de Treemap com dados de exemplo já carregados, depois substitua-os pelos seus.

Abrir o modelo

Publique, incorpore ou exporte

A reta final é igual para todo tipo de gráfico: o Share transforma o gráfico em um link público interativo e em um código de incorporação; o Export gera um arquivo estático.

Share: link público e código de incorporação

Ativar o código de incorporação e o link público é o que publica o gráfico. O link pode ser enviado com segurança para qualquer pessoa, e o código de incorporação entra em qualquer página como um iframe que mantém a interatividade e os tooltips ao passar o mouse. Edite o gráfico depois e clique em Recreate para levar essas mudanças aos dois.

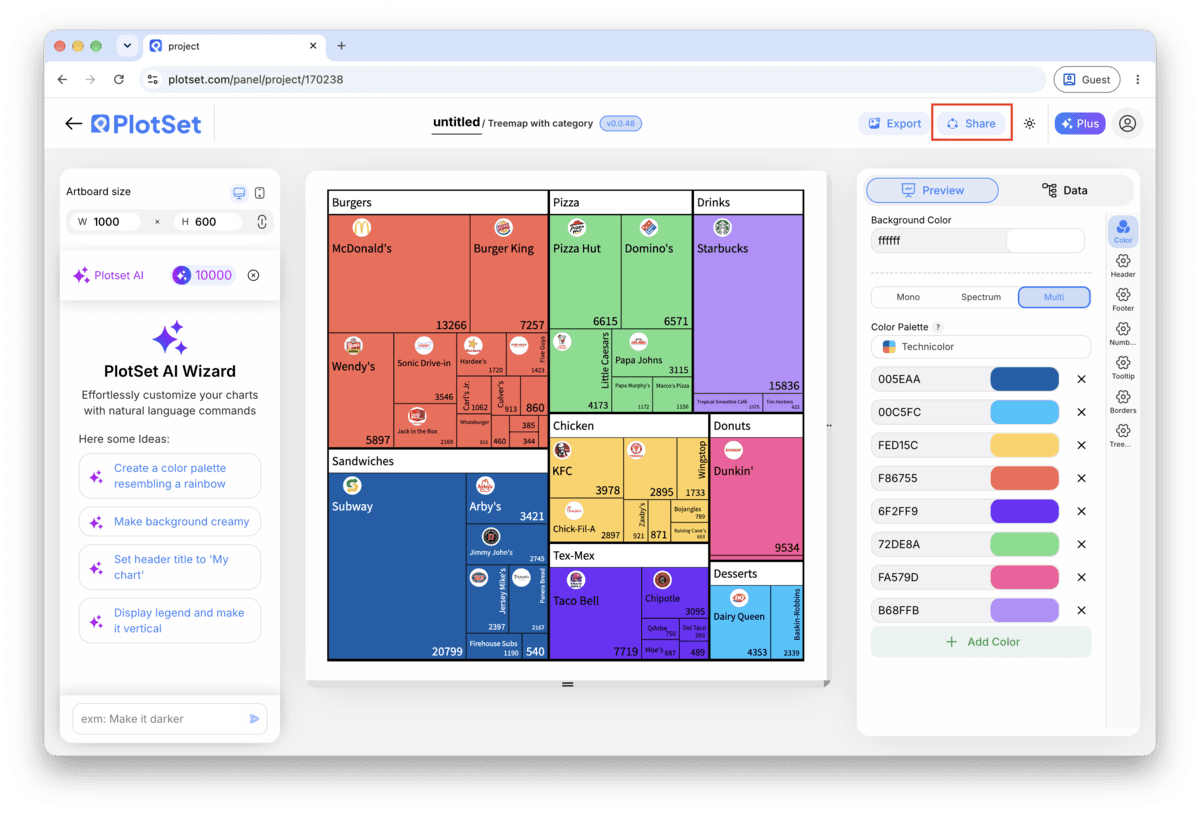
A barra de ferramentas do editor do PlotSet com o botão Share em destaque, ao lado do botão Export.
É pelo Share que um gráfico finalizado vira um link público e um código de incorporação.
A janela Share do PlotSet: a chave que ativa o código de incorporação e o link público, os botões Link, Embed, Facebook, Reddit, Twitter, LinkedIn e Email, e o link público do gráfico com um botão Copy.
Ative o código de incorporação e o link público, depois copie o link ou pegue o iframe. O Recreate leva as edições seguintes a todo mundo que já tem o link.

Export: SVG, PNG ou JPG

O Export grava uma cópia estática no tamanho que você precisar. O SVG continua nítido em qualquer escala e ainda pode ser editado em uma ferramenta de design; PNG e JPG são as escolhas seguras para slides e documentos. É o multiplicador de escala que garante uma imagem nítida em uma tela retina.

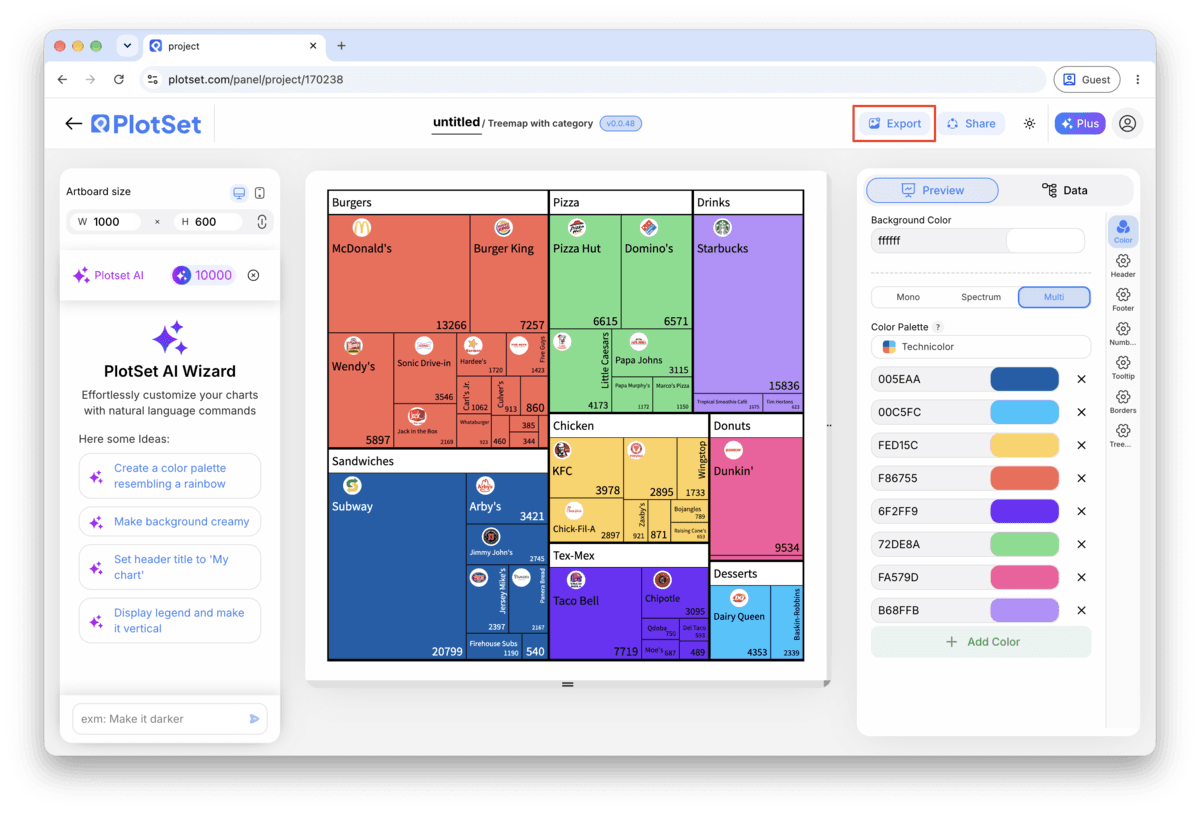
A barra de ferramentas do editor do PlotSet com o botão Export em destaque.
O Export é o caminho para gerar um arquivo estático para um slide ou um relatório.
A janela Export chart do PlotSet: um seletor de escala em 2x, campos de largura e altura definidos como 1000 por 600 e o menu de formatos aberto com SVG, PNG e JPG.
O SVG continua nítido em qualquer tamanho e editável em uma ferramenta de design; PNG e JPG são as escolhas seguras para uma apresentação. Defina a escala antes de exportar para que a imagem fique nítida em uma tela retina.

Dicas de estilo para um Treemap

Group the long tail into one tile

If your data has three big categories and forty tiny ones, the tiny ones will shrink into unreadable slivers regardless of how you colour them. Sum the small rows into a single "Other" row before upload, and mention in a caption what it covers.

Use colour for the second variable you actually care about

A treemap gives you two channels to work with: area for value, colour for anything else. Wasting colour on the same value the area already shows (a common default) throws away half the chart's power. Try colouring by year-over-year change instead.

Keep the hierarchy to two levels

PlotSet will nest a third level, but by the time tiles are three groups deep, individual rectangles are too small to compare or even see. If your data goes deeper, pick the two levels that matter most to the reader and flatten the rest.

Name the "Other" bucket specifically

"Other" on its own reads as a shrug. "Other: 14 regions under $50k" tells the reader exactly what got folded in and why it is not broken out, without them needing to ask.

Erros comuns ao fazer um Treemap

A tile is missing even though the row is in the sheet

The parent name in that row almost certainly does not match a category value exactly, often a trailing space or a different capitalisation. Compare the two columns directly in the spreadsheet, fix the mismatch, and re-upload rather than editing inside PlotSet.

One enormous tile dominates the whole treemap

This is usually a subtotal or grand total row from a pivot export that got uploaded as if it were a real category. Scroll to the bottom of the source sheet, delete the totals row, and re-upload.

Half the tiles are unlabelled and it looks broken

It is not broken: PlotSet is hiding labels that would overlap or overflow a small tile. Check the hover tooltip to confirm the value is still there, and if you need more tiles labelled, group the smallest ones into an "Other" tile so the remaining ones have more room.

Saiba mais sobre o Treemap

Não tem certeza se o Treemap é a escolha certa? Veja o que é, quando usar e quando evitar.

Sobre o Treemap

Treemap: perguntas frequentes

Three columns: category, parent, and value, with one row per tile. Leave the parent blank for top-level tiles, or drop the column entirely for a flat treemap with no hierarchy. CSV and .xlsx both work.

Crie seu Treemap agora

Grátis para começar com mais de 300 modelos. Sem cartão de crédito.