
Cada gráfico aqui começou como uma planilha.
Mapas, bar chart races, treemaps, pictogramas e mais. Abra um e refaça com os seus dados.
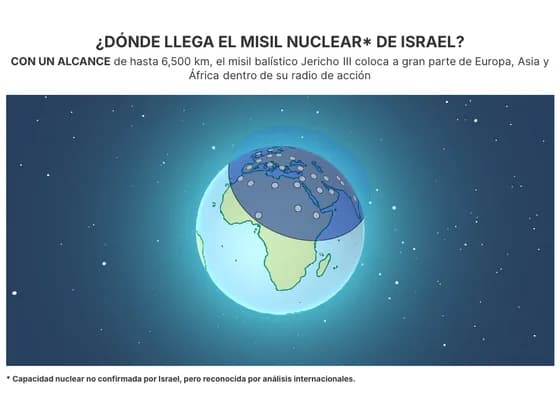 3D globe¿DÓNDE LLEGA EL MISIL NUCLEAR* DE ISRAEL?
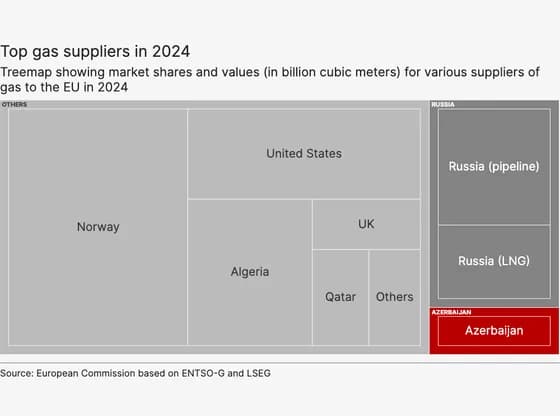 HierarchyTop gas suppliers in 2024
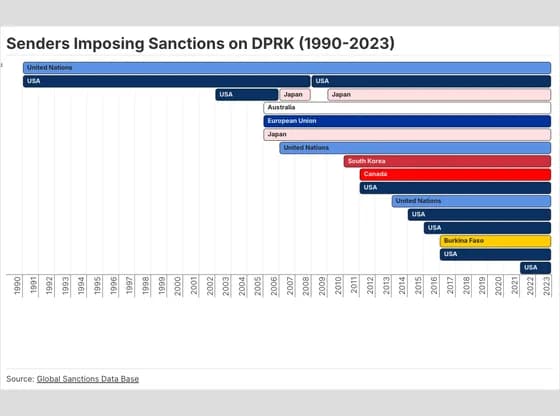 Gantt chartSenders Imposing Sanctions on DPRK (1990-2023)
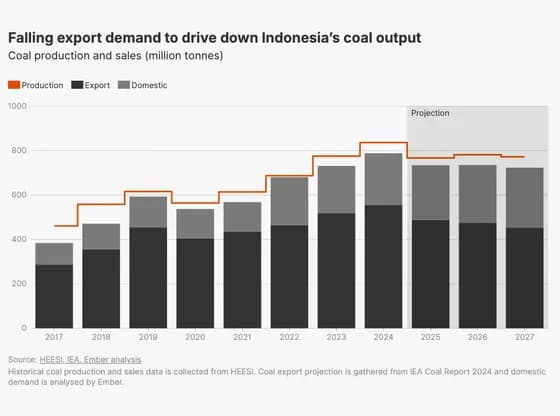 Line, bar and pie chartsFalling export demand to drive down Indonesia’s coal output
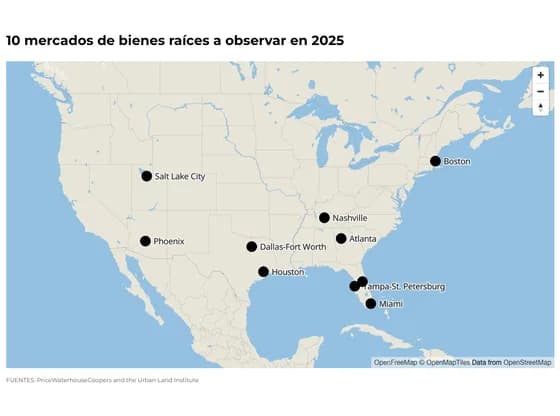 3D map10 mercados de bienes raíces a observar en 2025
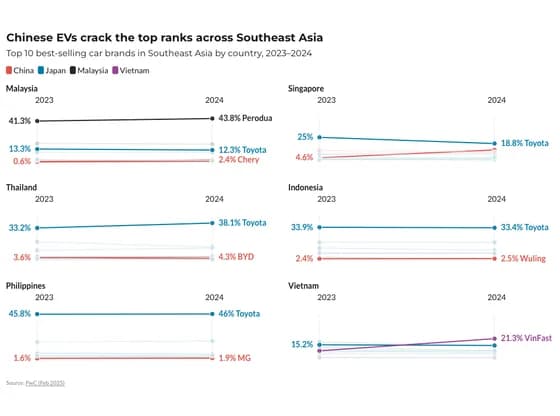 Slope chartChinese EVs crack the top ranks across Southeast Asia
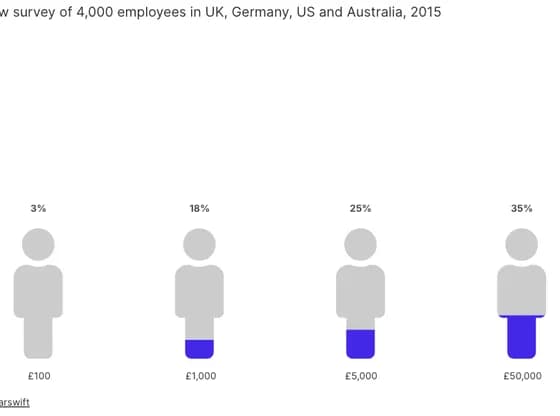 PictogramPercentage of employees willing to sell company data
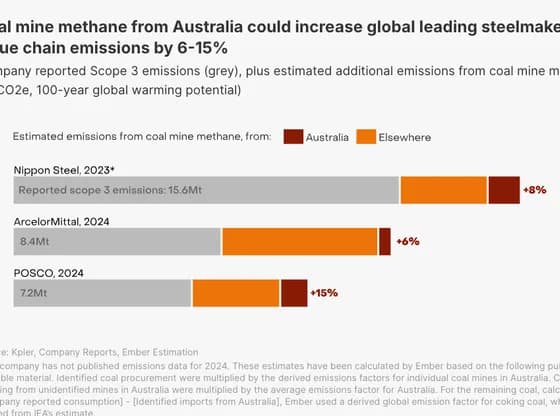 Interactive SVGCoal mine methane from Australia could increase global leading steelmakers' value chain…
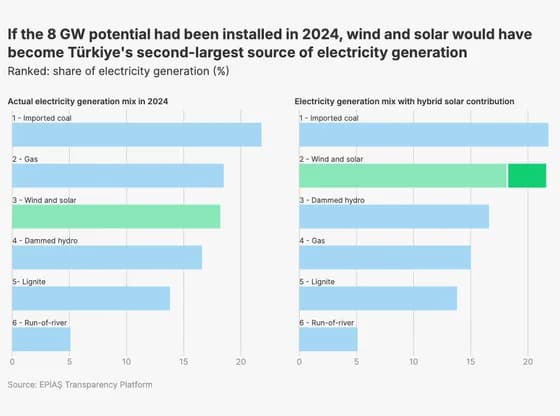 Line, bar and pie chartsIf the 8 GW potential had been installed in 2024, wind and solar would have become Türkiye's…
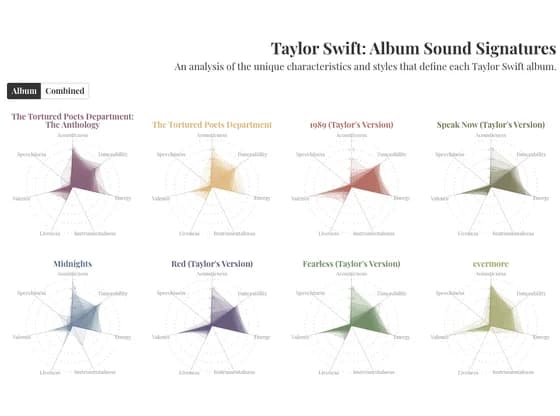 Radar chartTaylor Swift: Album Sound Signatures
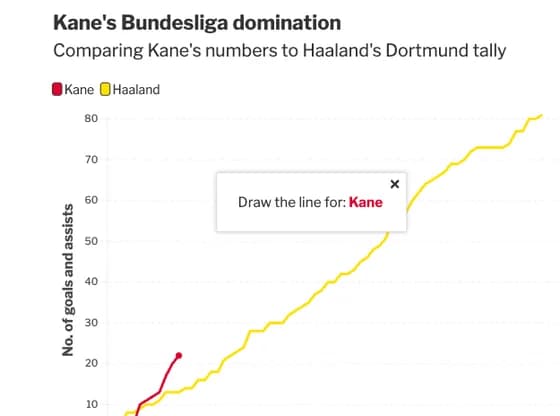 Interactive toolsKane's Bundesliga domination
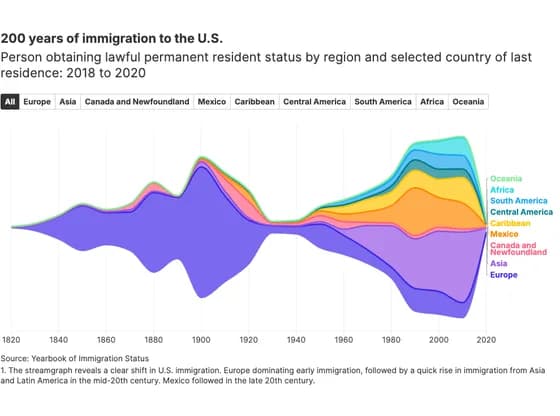 Line, bar and pie charts200 years of immigration to the U.S.
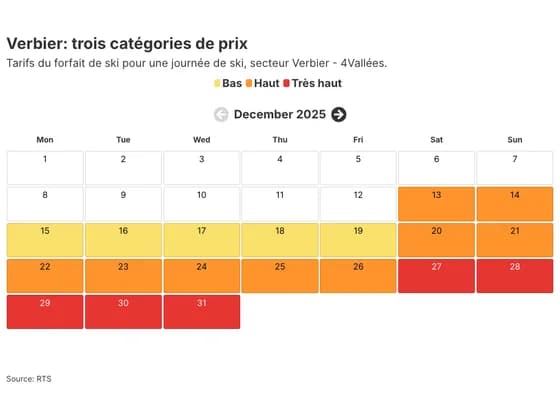 3D plotsVerbier: trois catégories de prix
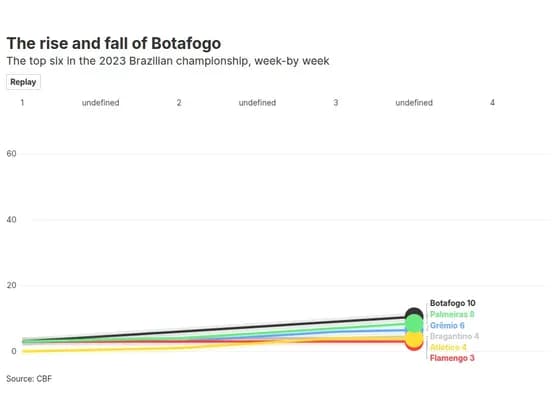 Animated chartsThe rise and fall of Botafogo
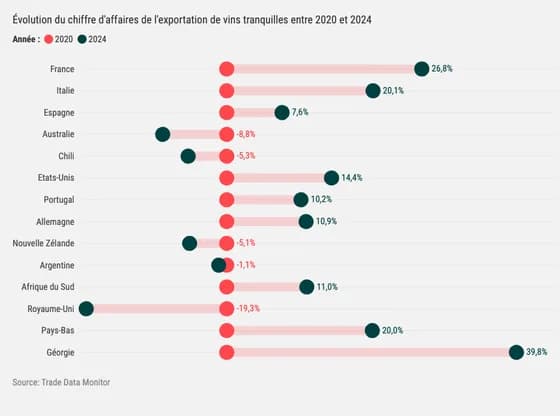 ScatterÉvolution du chiffre d'affaires de l'exportation de vins tranquilles entre 2020 et 2024
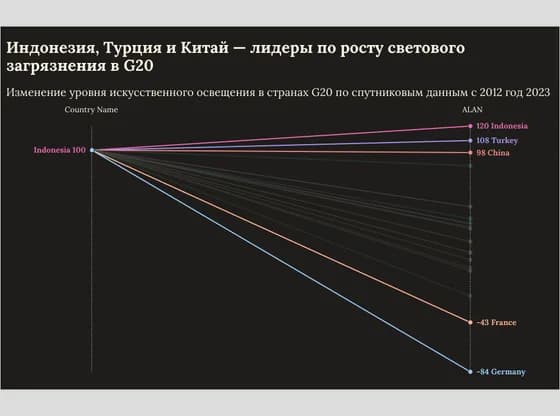 Slope chartИндонезия, Турция и Китай — лидеры по росту светового загрязнения в G20
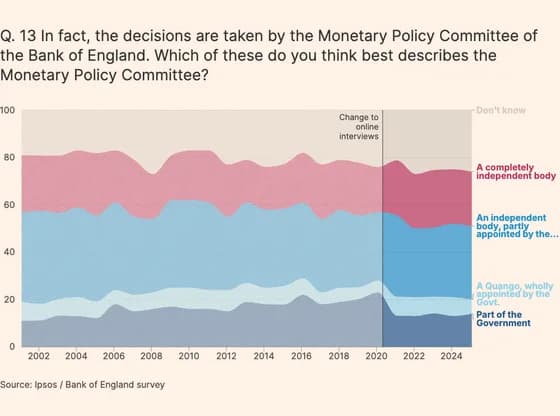 Line, bar and pie chartsQ. 13 In fact, the decisions are taken by the Monetary Policy Committee of the Bank of England.…
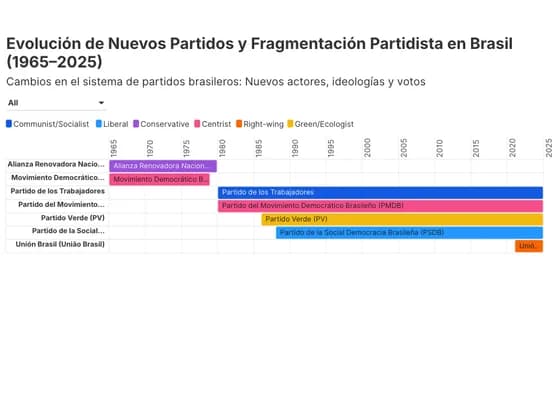 Gantt chartEvolución de Nuevos Partidos y Fragmentación Partidista en Brasil (1965–2025)
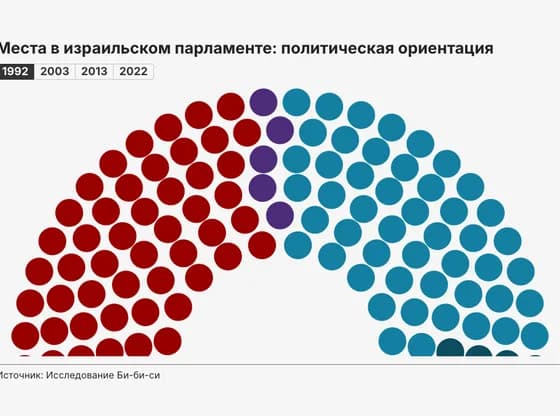 Elections and parliamentsМеста в израильском парламенте: политическая ориентация
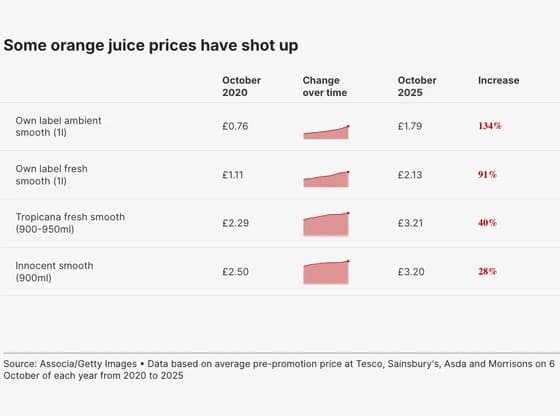 TableSome orange juice prices have shot up