
Cada gráfico aqui começou como uma planilha.
Mapas, bar chart races, treemaps, pictogramas e mais. Abra um e refaça com os seus dados.
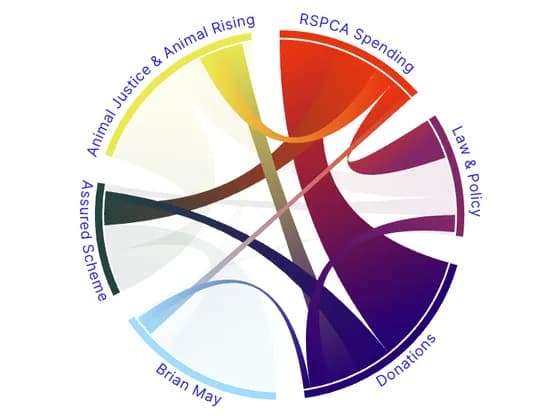 Network graphThe intersection (% overlap) between RSPCA Spending and Donating to the RSPCA September 2024
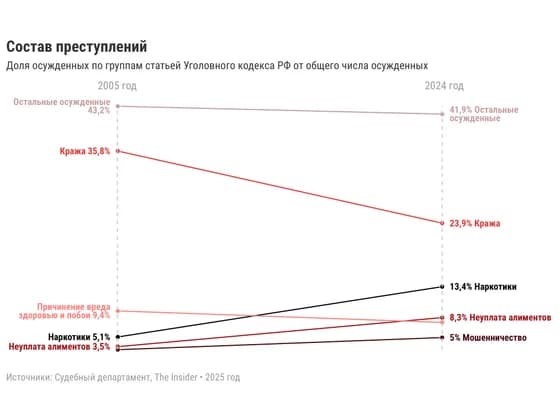 Slope chartСостав преступлений
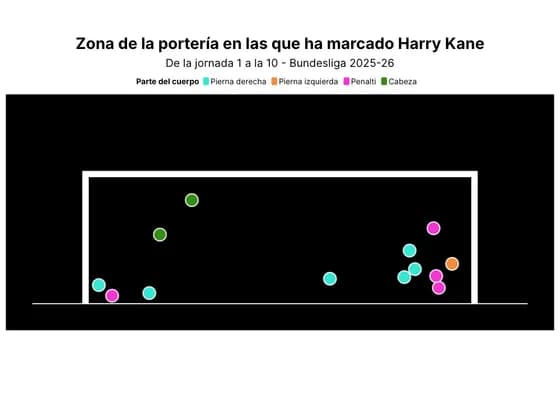 SportsZona de la portería en las que ha marcado Harry Kane
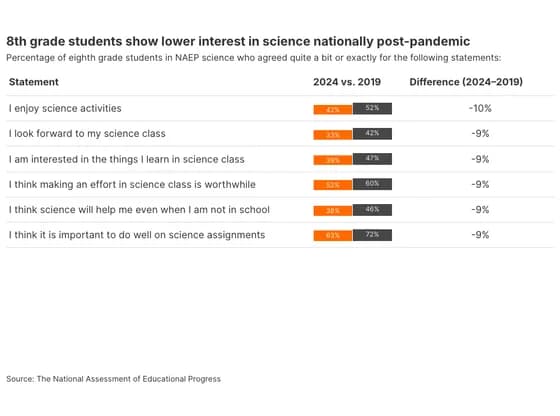 Table8th grade students show lower interest in science nationally post-pandemic
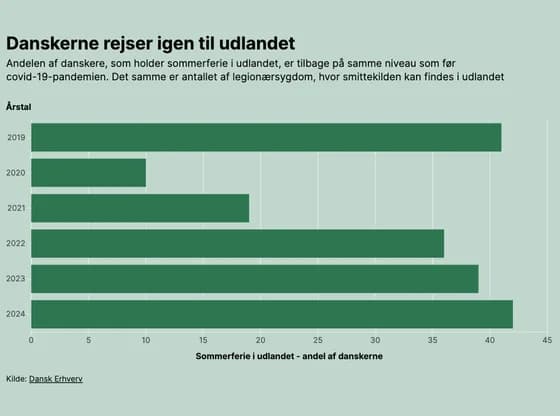 Line, bar and pie chartsDanskerne rejser igen til udlandet
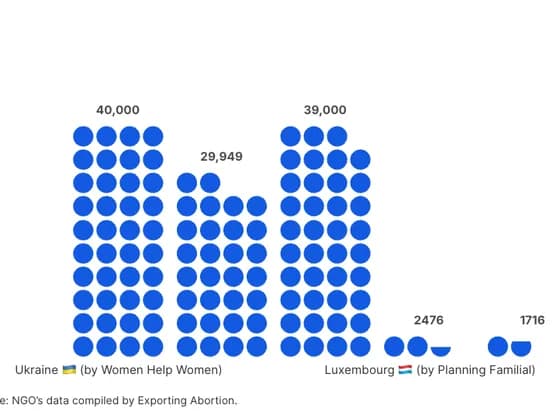 PictogramAbortion pill packages distributed by NGO's between 2019 and 2023
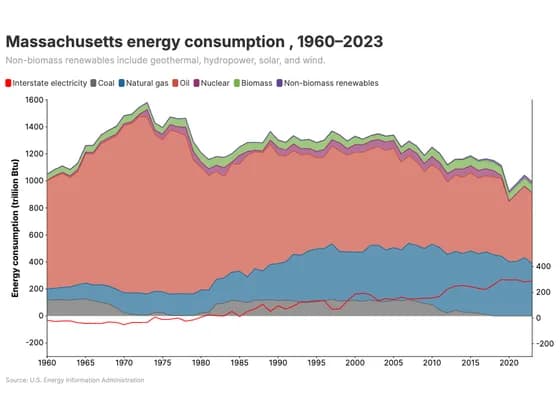 Line, bar and pie chartsMassachusetts energy consumption , 1960–2023
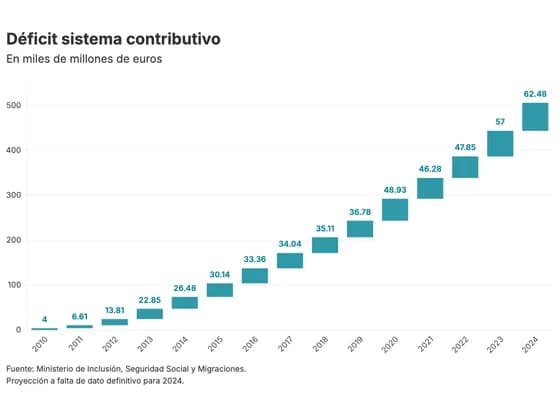 Line, bar and pie chartsDéficit sistema contributivo
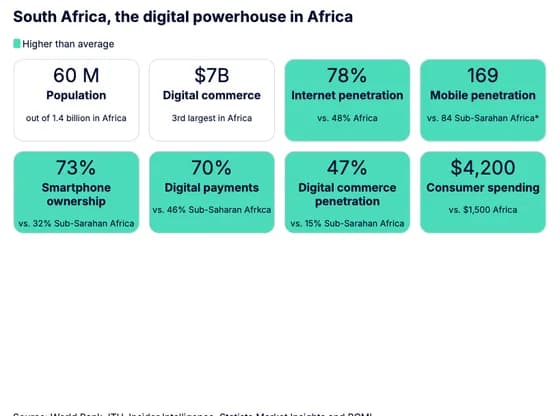 CardsSouth Africa, the digital powerhouse in Africa
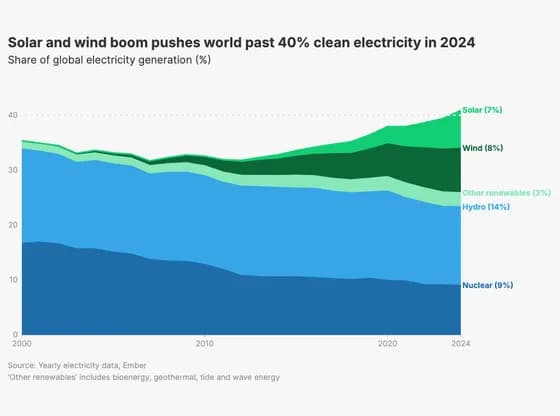 Line, bar and pie chartsSolar and wind boom pushes world past 40% clean electricity in 2024
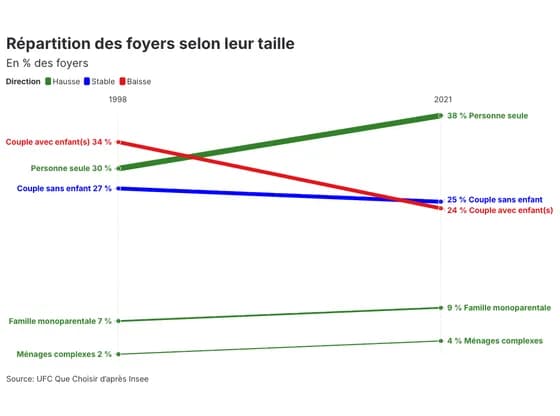 Slope chartRépartition des foyers selon leur taille
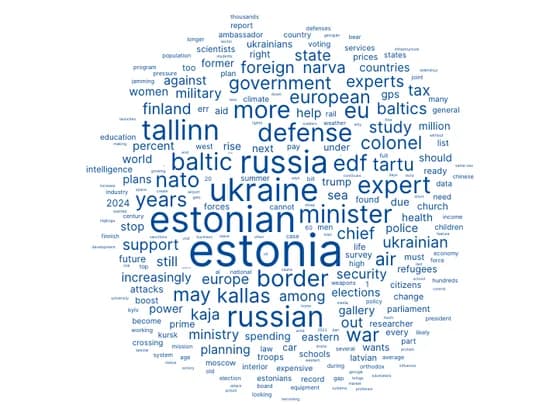 OtherI. Contributions
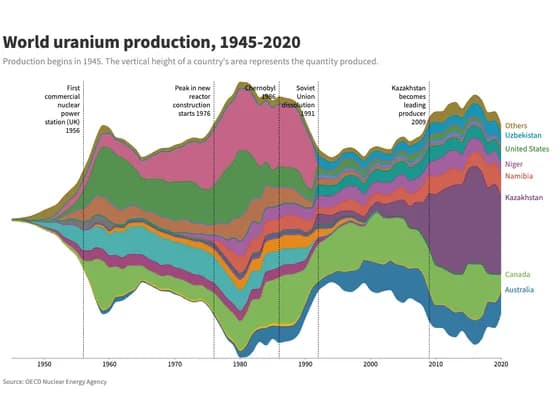 Line, bar and pie chartsWorld uranium production, 1945-2020
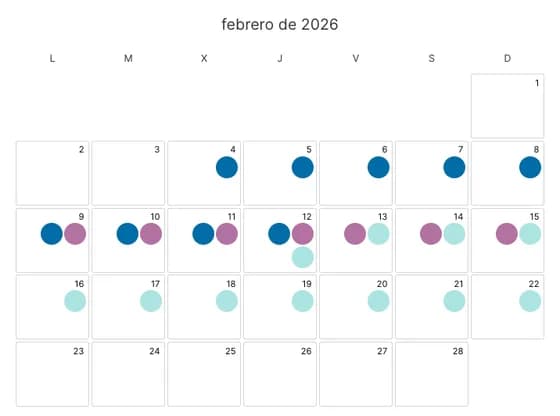 3D plotsCalendario de las pruebas de trineo en Milano Cortina 2026
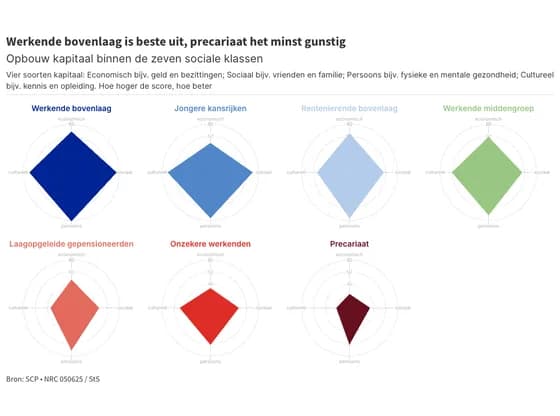 Radar chartWerkende bovenlaag is beste uit, precariaat het minst gunstig
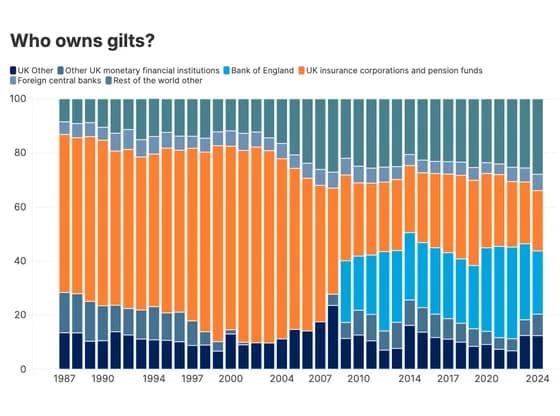 Line, bar and pie chartsWho owns gilts?
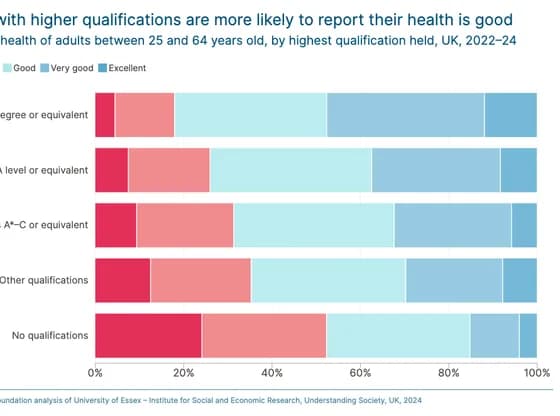 Line, bar and pie chartsPeople with higher qualifications are more likely to report their health is good
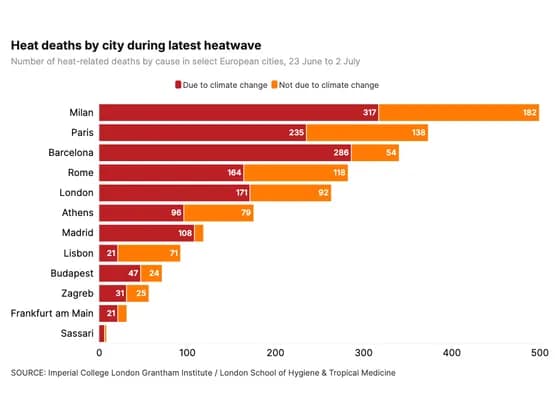 Line, bar and pie chartsHeat deaths by city during latest heatwave
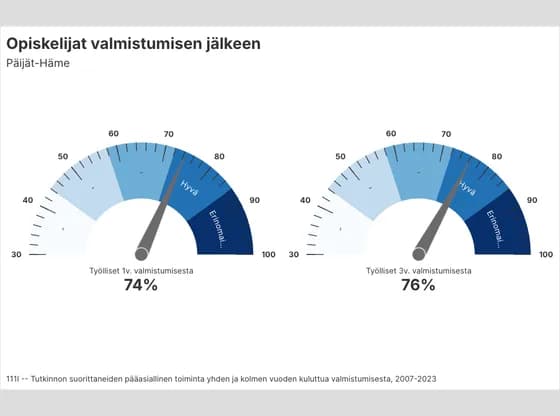 Counters and gaugesOpiskelijat valmistumisen jälkeen
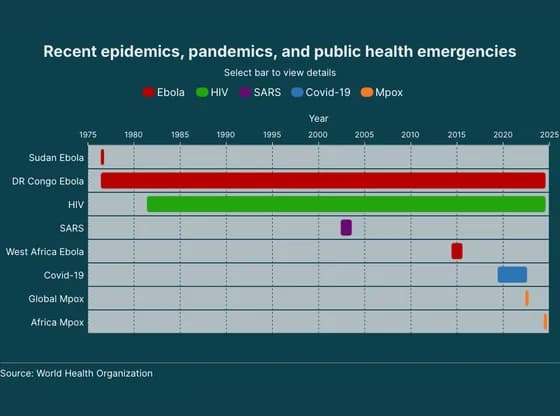 Gantt chartRecent epidemics, pandemics, and public health emergencies