
Cada gráfico aqui começou como uma planilha.
Mapas, bar chart races, treemaps, pictogramas e mais. Abra um e refaça com os seus dados.
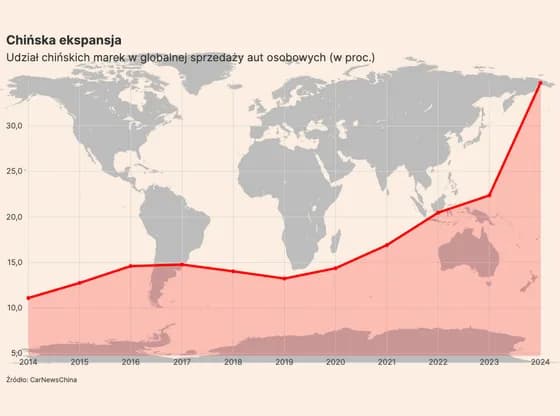 Line, bar and pie chartsChińska ekspansja
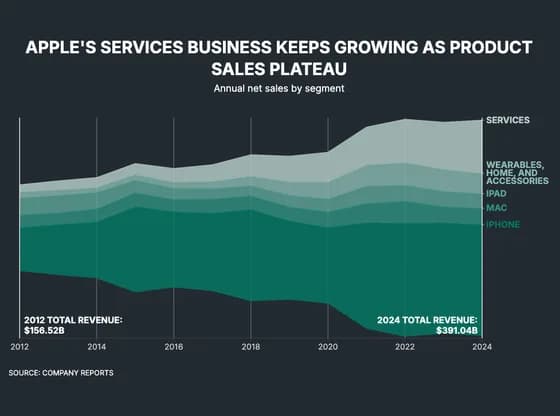 Line, bar and pie chartsAPPLE'S SERVICES BUSINESS KEEPS GROWING AS PRODUCT SALES PLATEAU
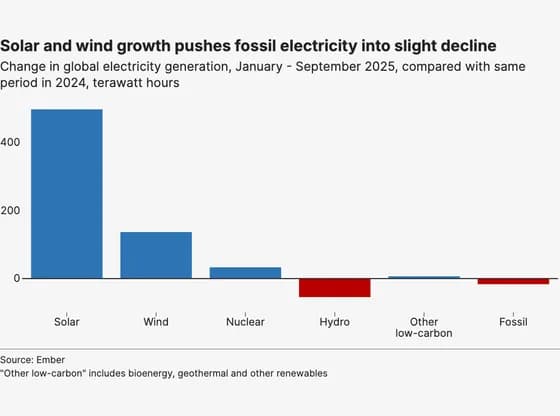 Line, bar and pie chartsSolar and wind growth pushes fossil electricity into slight decline
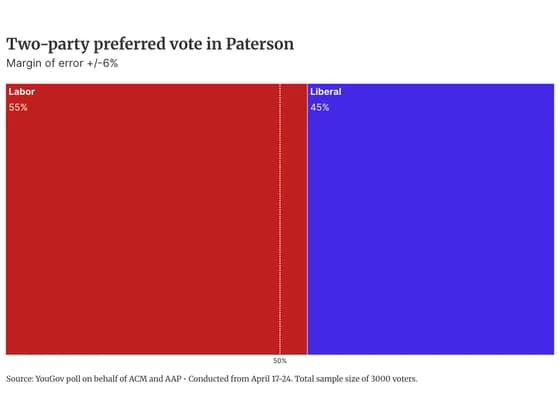 Elections and parliamentsTwo-party preferred vote in Paterson
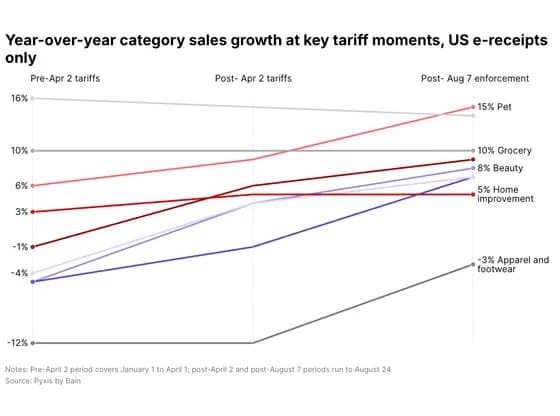 Slope chartYear-over-year category sales growth at key tariff moments, US e-receipts only
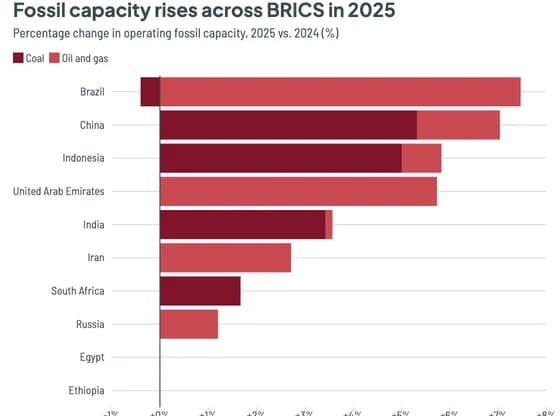 Line, bar and pie chartsFossil capacity rises across BRICS in 2025
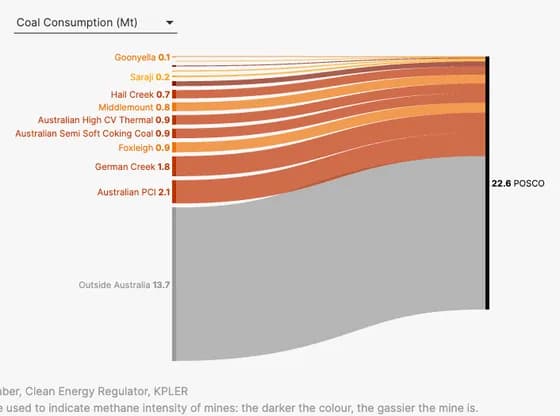 Sankey diagramIn 2024, almost one fourth of coal mine methane emissions in POSCO's supply chain was from Australia
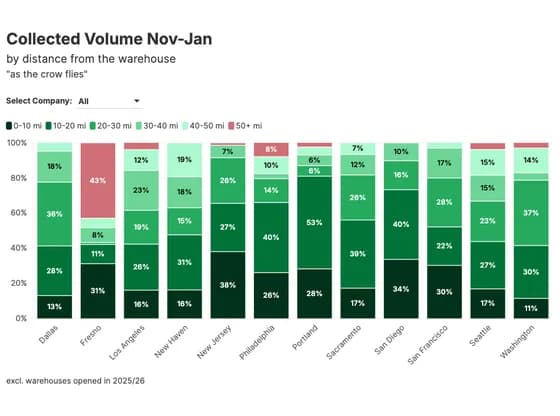 Line, bar and pie chartsCollected Volume Nov-Jan
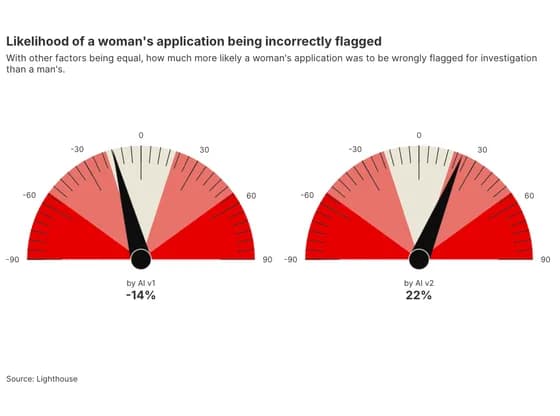 Counters and gaugesLikelihood of a woman's application being incorrectly flagged
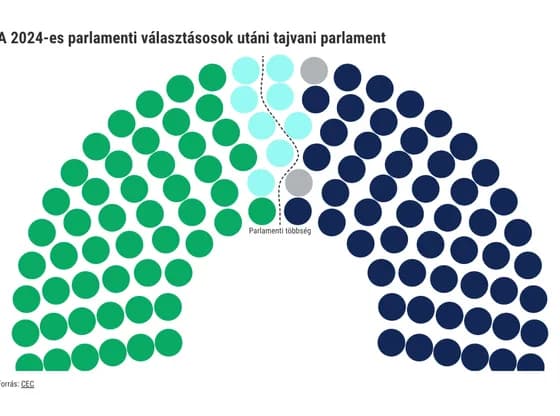 Elections and parliamentsA 2024-es parlamenti választásosok utáni tajvani parlament
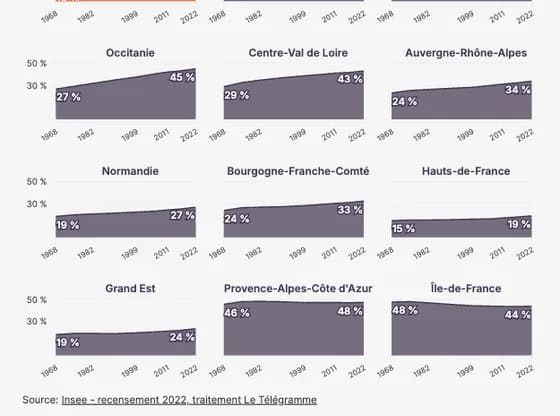 Line, bar and pie chartsDans l'Hexagone, la part de personnes nées ailleurs progresse partout hors Île-de-France, et…
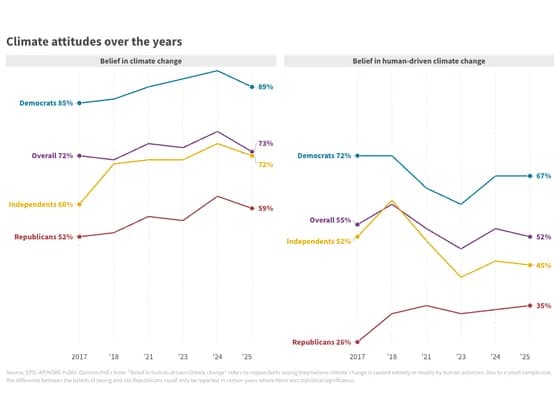 Slope chartClimate attitudes over the years
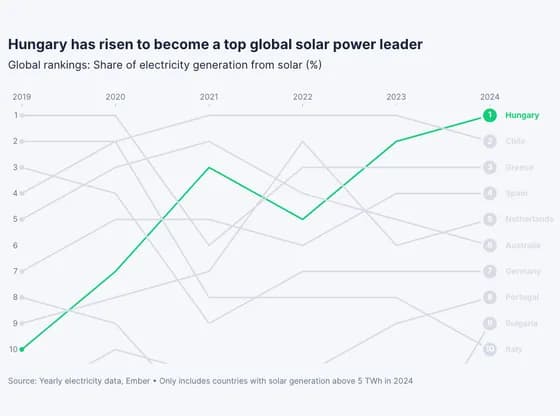 Animated chartsHungary has risen to become a top global solar power leader
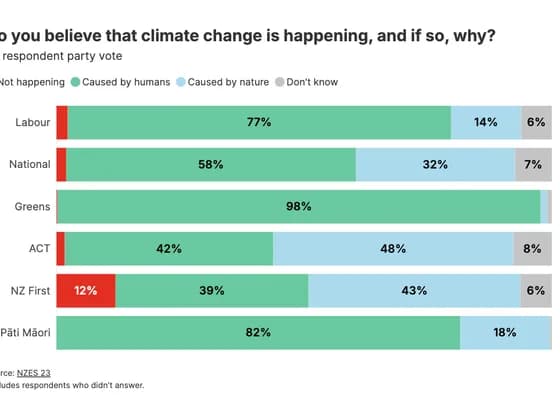 Line, bar and pie chartsDo you believe that climate change is happening, and if so, why?
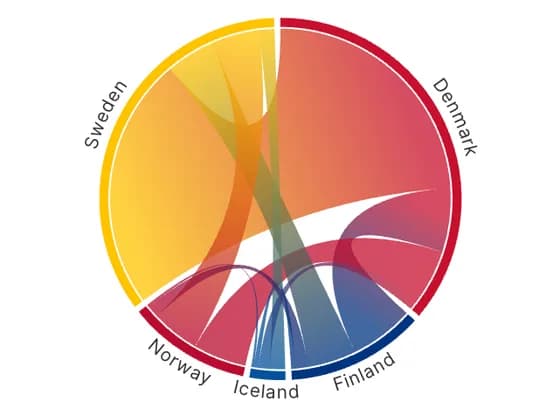 Network graphFlows of Musicians between the Nordic Countries
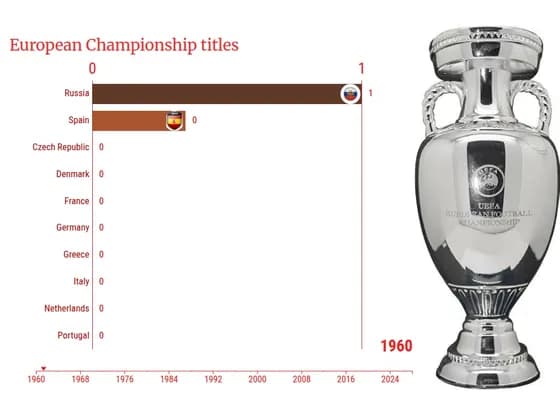 Animated chartsEuropean Championship titles
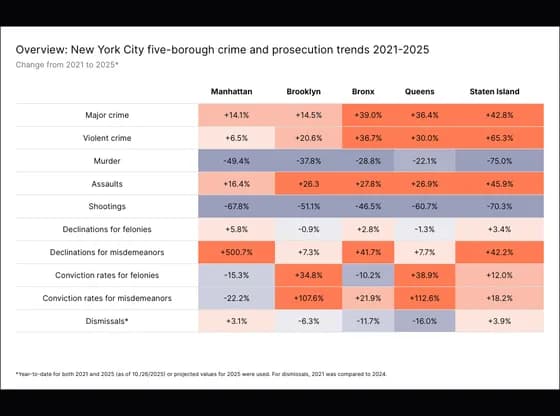 TableOverview: New York City five-borough crime and prosecution trends 2021-2025
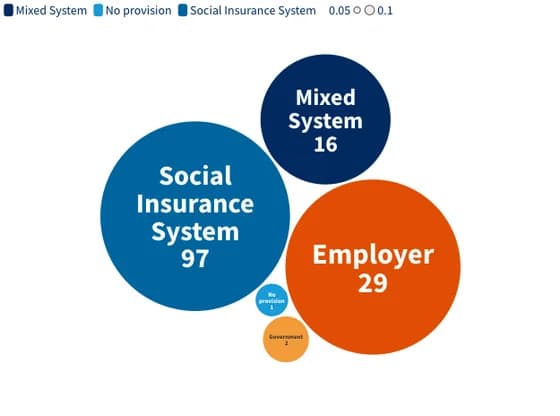 Distribution chartsWho Pays for Maternity Leave in 2025?
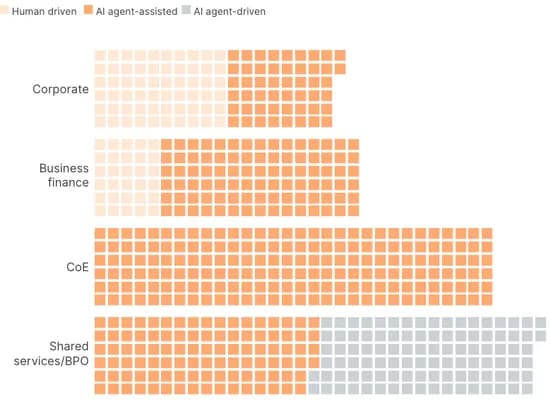 PictogramWhere AI agents make the biggest impact in finance
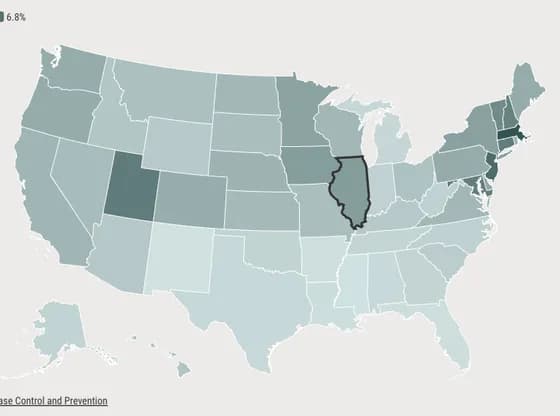 MapsIllinois had the 9th highest fertility treatment rate in 2023