
Cada gráfico aqui começou como uma planilha.
Mapas, bar chart races, treemaps, pictogramas e mais. Abra um e refaça com os seus dados.
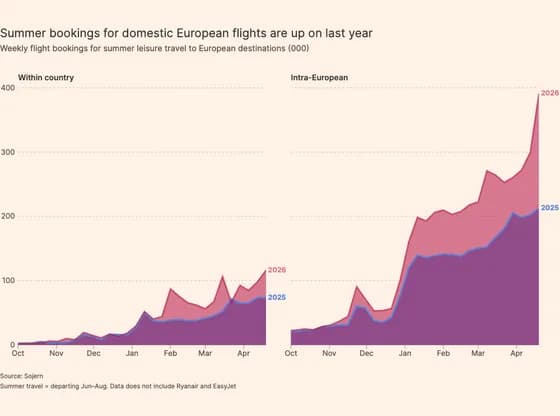 Line, bar and pie chartsSummer bookings for domestic European flights are up on last year
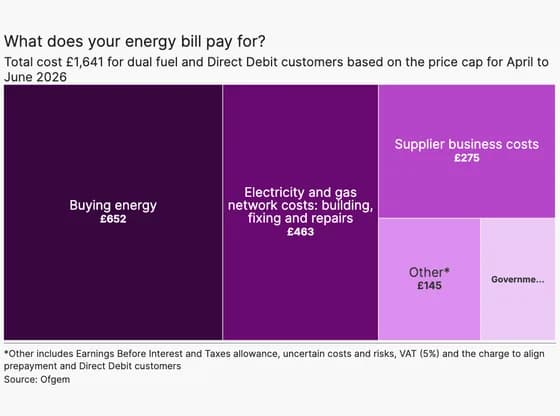 HierarchyWhat does your energy bill pay for?
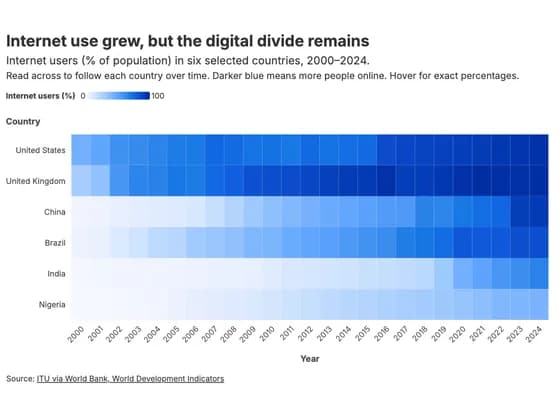 HeatmapInternet use grew, but the digital divide remains
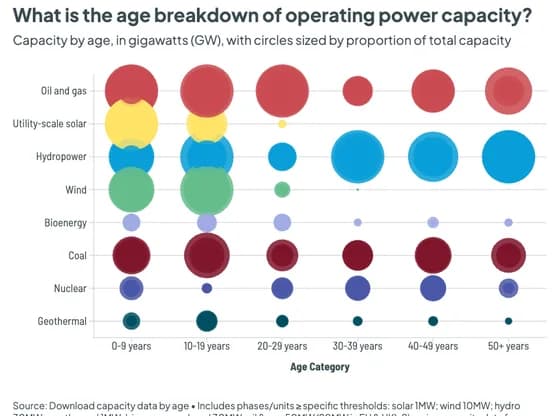 ScatterWhat is the age breakdown of operating power capacity?
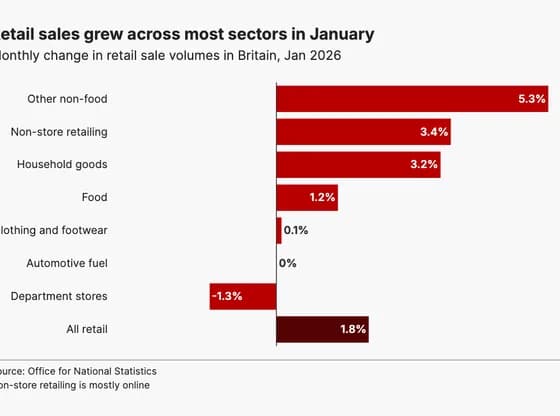 Line, bar and pie chartsRetail sales grew across most sectors in January
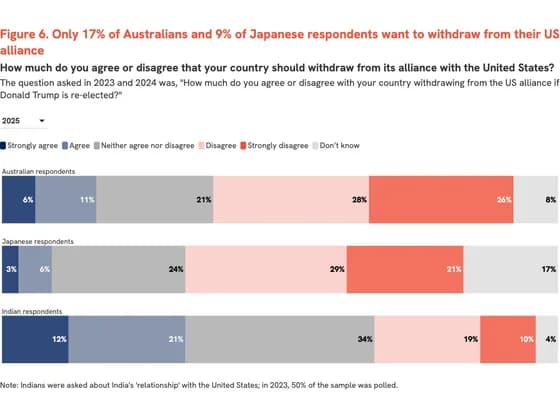 Line, bar and pie chartsFigure 6. Only 17% of Australians and 9% of Japanese respondents want to withdraw from their US…
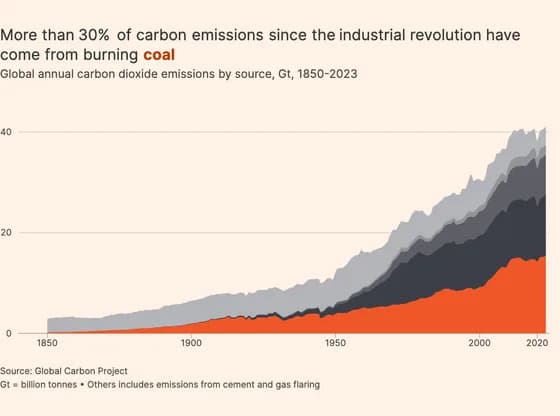 Line, bar and pie chartsMore than 30% of carbon emissions since the industrial revolution have come from burning coal
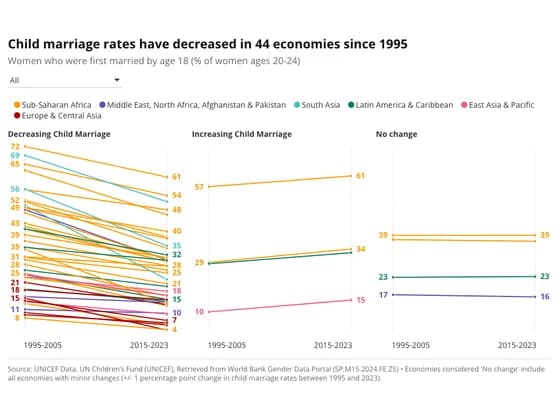 Slope chartChild marriage rates have decreased in 44 economies since 1995
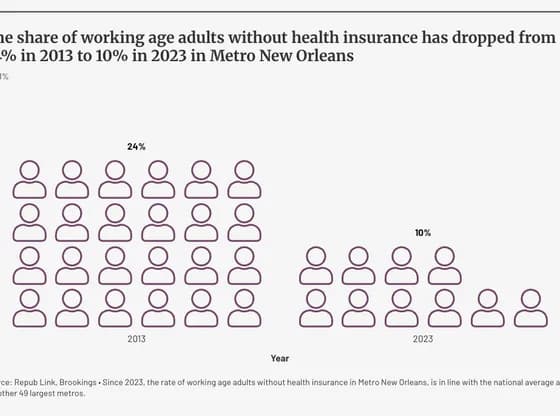 PictogramThe share of working age adults without health insurance has dropped from 24% in 2013 to 10% in…
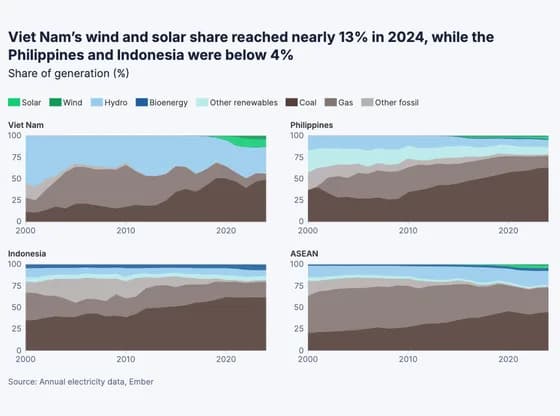 Line, bar and pie chartsViet Nam’s wind and solar share reached nearly 13% in 2024, while the Philippines and Indonesia…
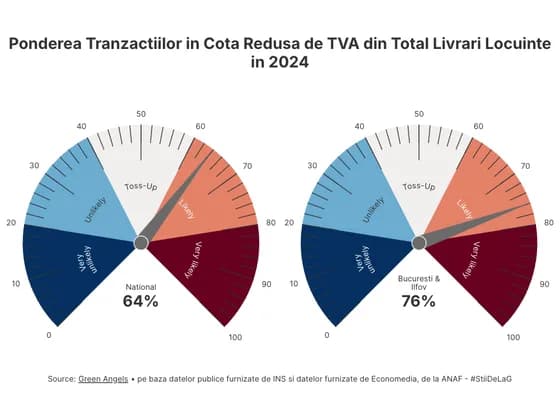 Counters and gaugesPonderea Tranzactiilor in Cota Redusa de TVA din Total Livrari Locuinte in 2024
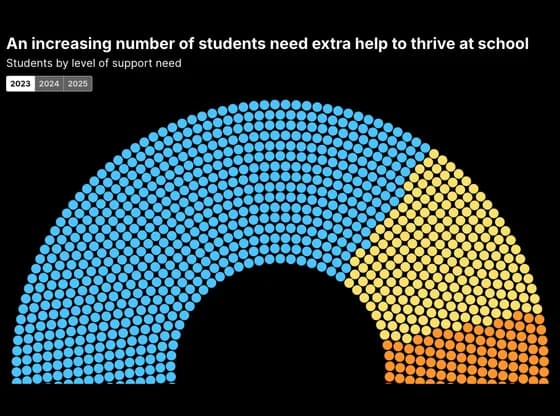 Elections and parliamentsAn increasing number of students need extra help to thrive at school
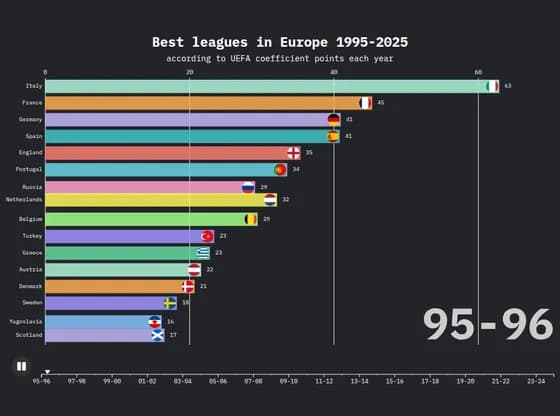 Animated chartsBest leagues in Europe 1995-2025
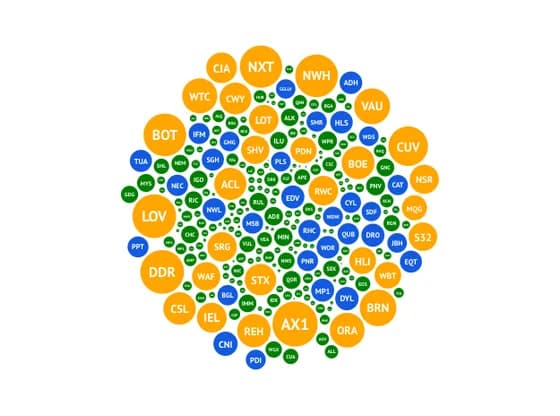 Distribution chartsThe 2025 AGM season
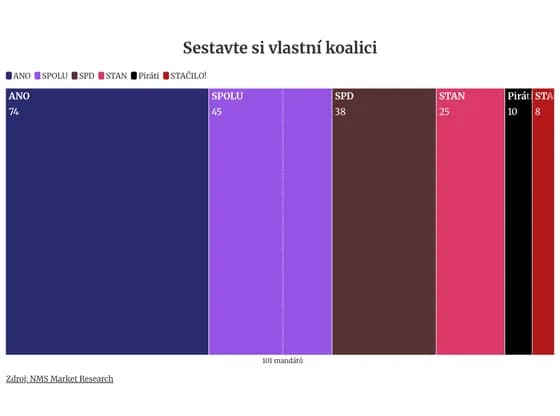 Elections and parliamentsSestavte si vlastní koalici
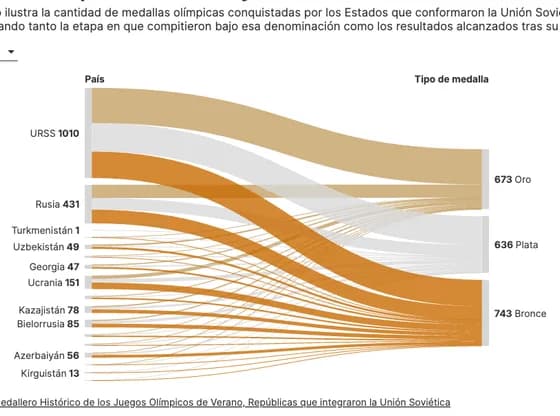 Sankey diagramMedallas olímpicas de la URSS y sus Estados sucesores
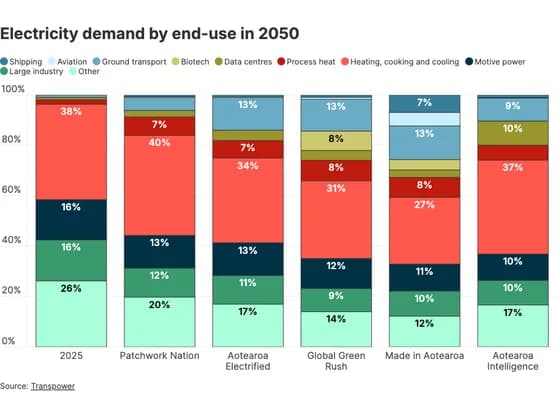 Line, bar and pie chartsElectricity demand by end-use in 2050
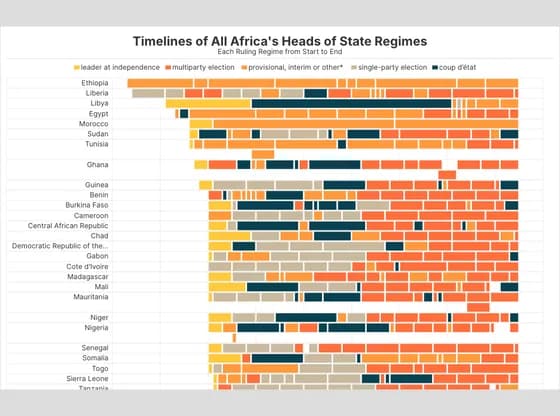 Gantt chartTimelines of All Africa's Heads of State Regimes
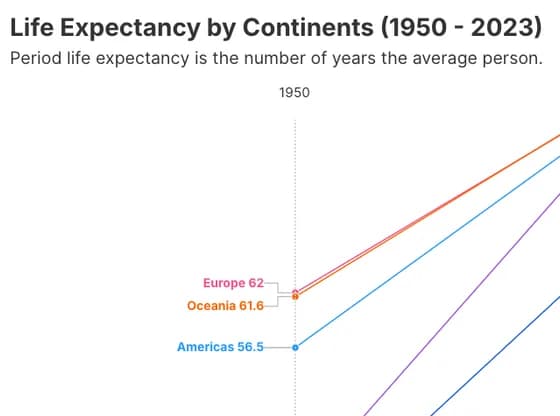 Slope chartLife Expectancy by Continents (1950 - 2023)
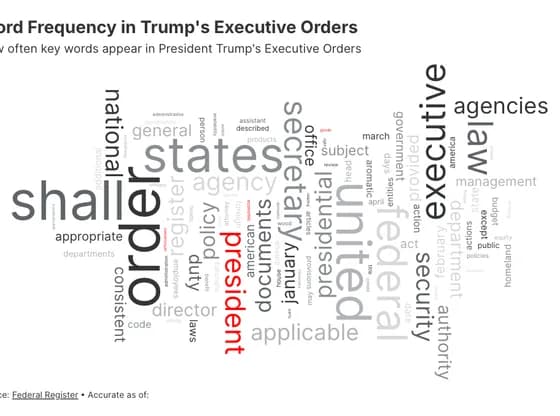 OtherWord Frequency in Trump's Executive Orders