
Cada gráfico aqui começou como uma planilha.
Mapas, bar chart races, treemaps, pictogramas e mais. Abra um e refaça com os seus dados.
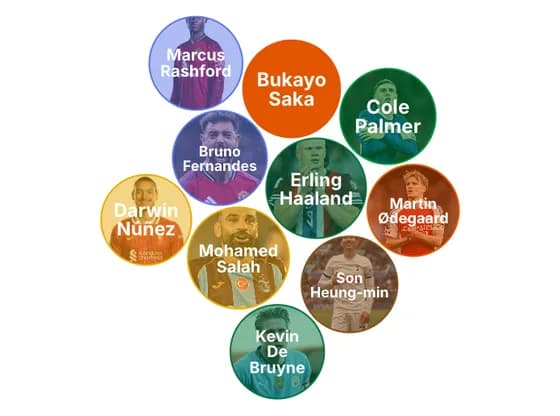 Distribution chartsRank the most popular players in the Premier League 2025
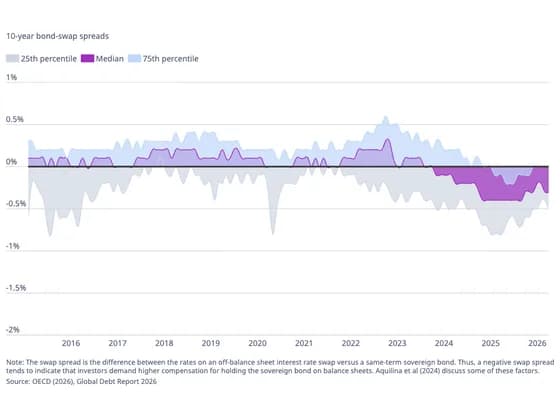 Line, bar and pie charts10-year bond-swap spreads
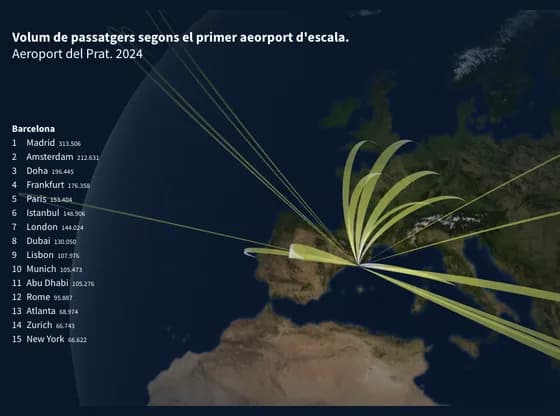 Connections and flow mapsVolum de passatgers segons el primer aeorport d'escala.
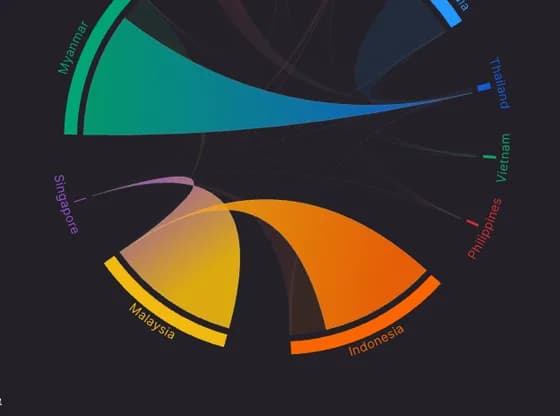 Network graphMigration flows across Southeast Asia, 2005
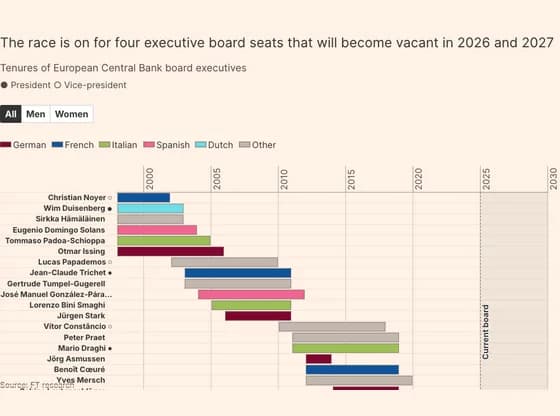 Gantt chartThe race is on for four executive board seats that will become vacant in 2026 and 2027
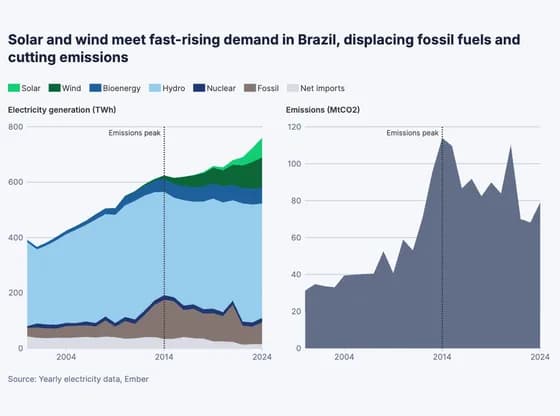 Line, bar and pie chartsSolar and wind meet fast-rising demand in Brazil, displacing fossil fuels and cutting emissions
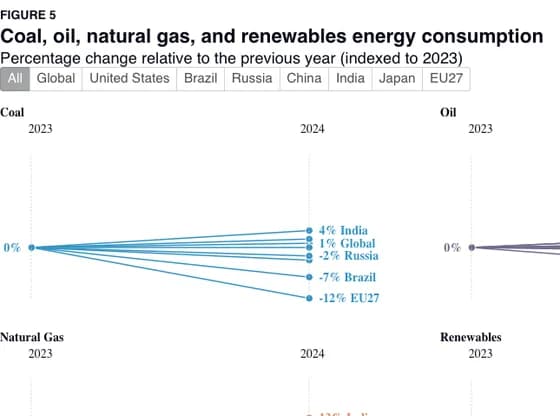 Slope chartFIGURE 5 Coal, oil, natural gas, and renewables energy consumption
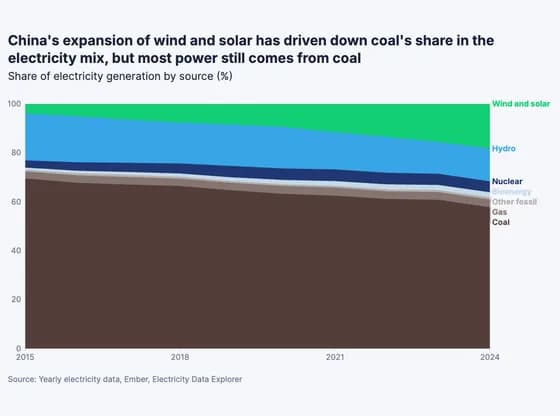 Line, bar and pie chartsChina's expansion of wind and solar has driven down coal's share in the electricity mix, but…
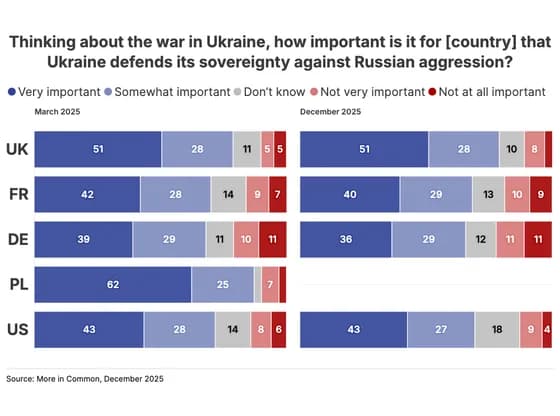 Line, bar and pie charts#337 TRACKER important_forcountry
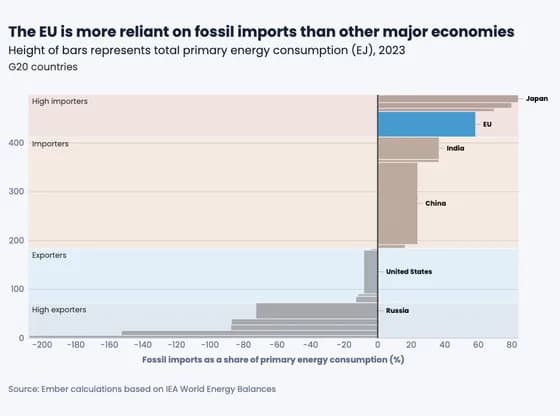 MarimekkoThe EU is more reliant on fossil imports than other major economies
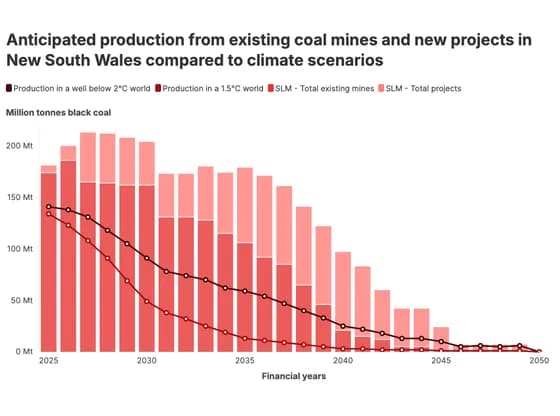 Line, bar and pie chartsAnticipated production from existing coal mines and new projects in New South Wales compared to…
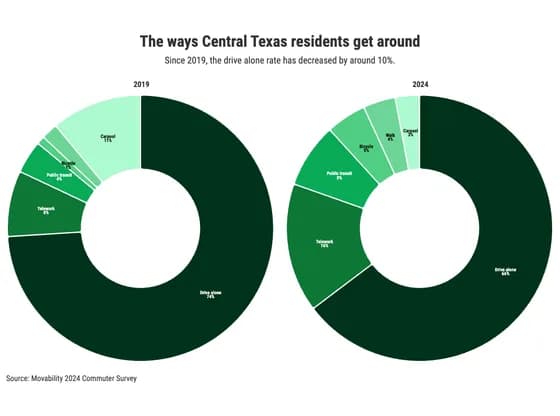 Line, bar and pie chartsThe ways Central Texas residents get around
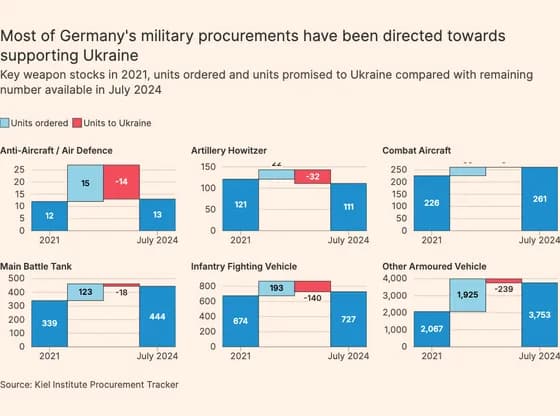 Line, bar and pie chartsMost of Germany's military procurements have been directed towards supporting Ukraine
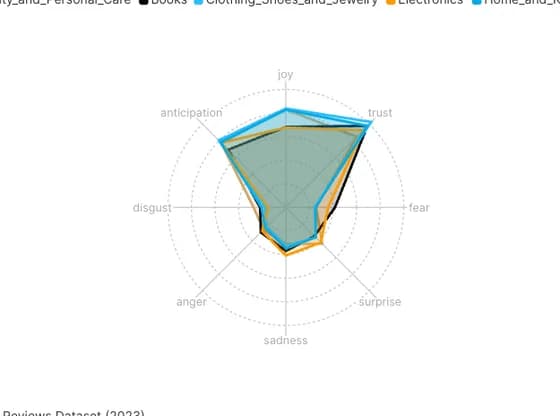 Radar chartSentiment & Emotion Radar: How Amazon Shoppers Reacted in 2023
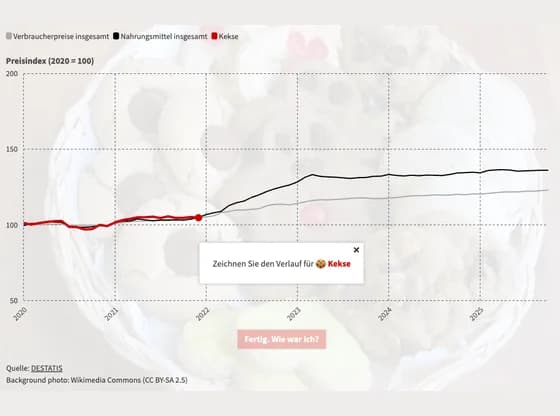 Interactive toolsKekse Preise zum Raten
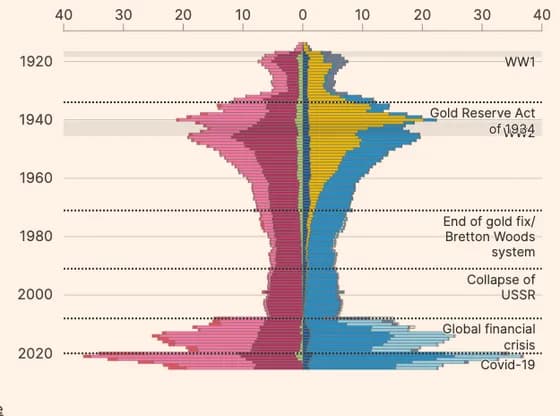 Line, bar and pie chartsA century of Fed balance sheets
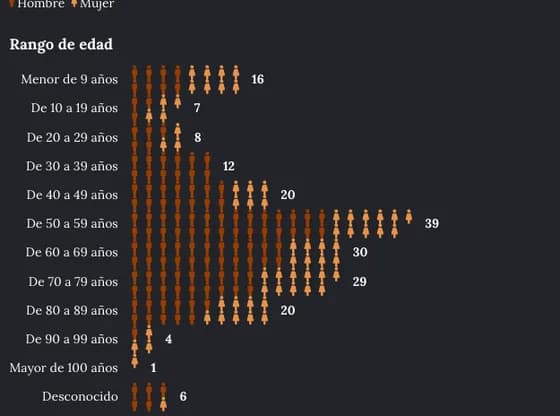 PictogramMiasis en humanos por gusano barrenador por edad
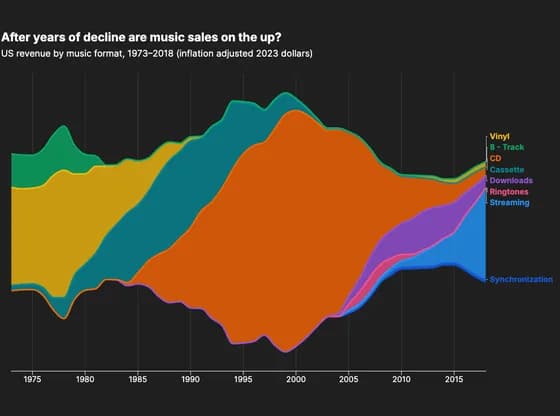 Line, bar and pie chartsAfter years of decline are music sales on the up?
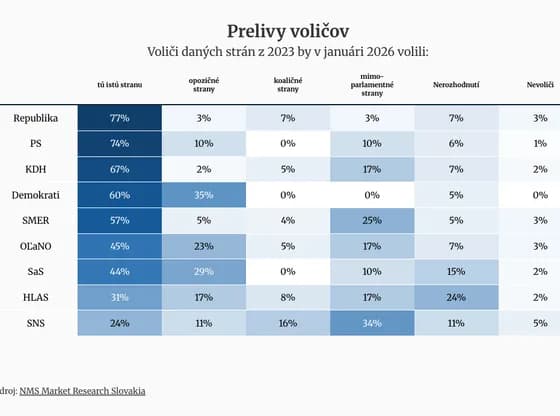 TablePrelivy voličov
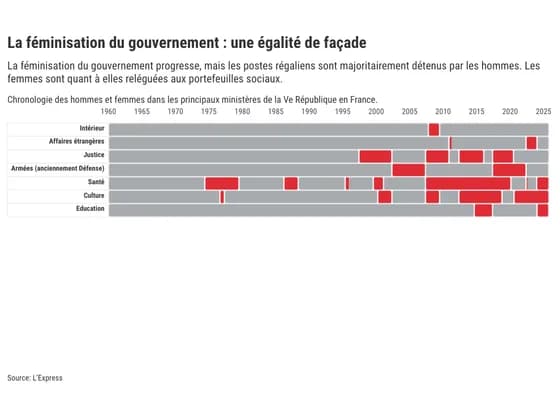 Gantt chartLa féminisation du gouvernement : une égalité de façade