
Cada gráfico aqui começou como uma planilha.
Mapas, bar chart races, treemaps, pictogramas e mais. Abra um e refaça com os seus dados.
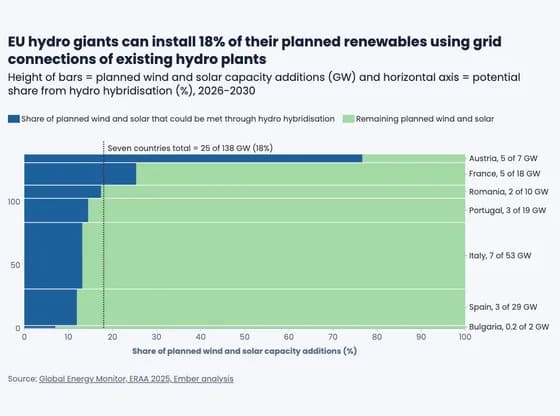 MarimekkoEU hydro giants can install 18% of their planned renewables using grid connections of existing…
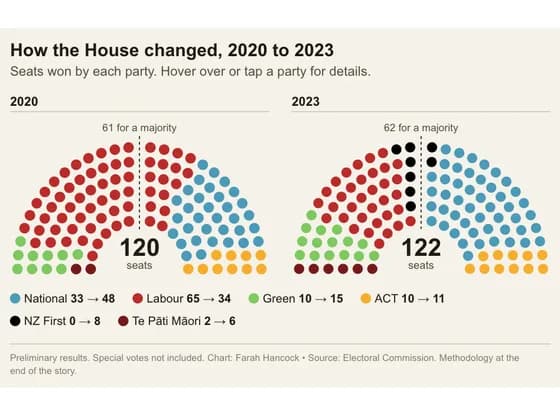 Interactive SVGThen_now_seats
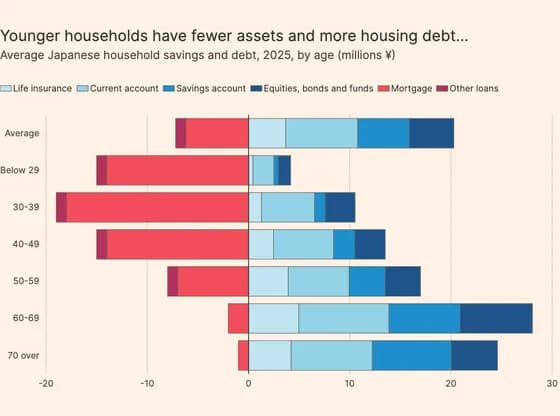 Line, bar and pie chartsYounger households have fewer assets and more housing debt...
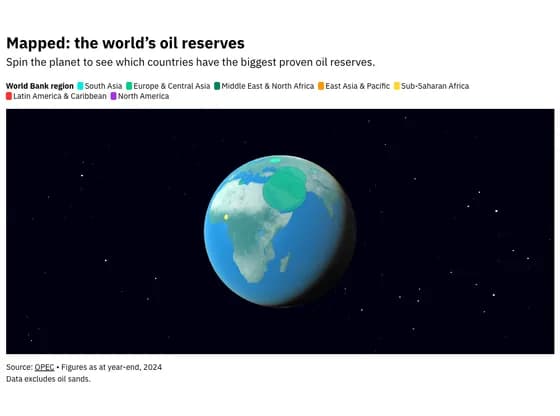 3D globeMapped: the world’s oil reserves
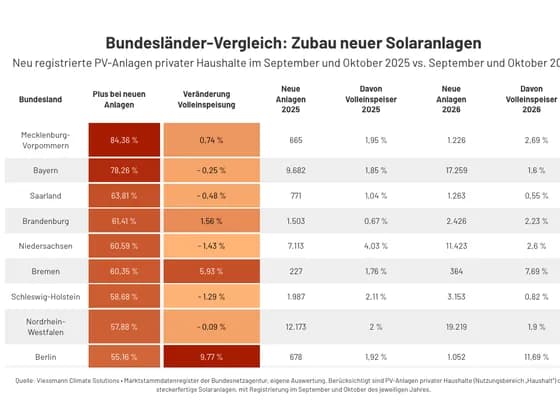 TableBundesländer-Vergleich: Zubau neuer Solaranlagen
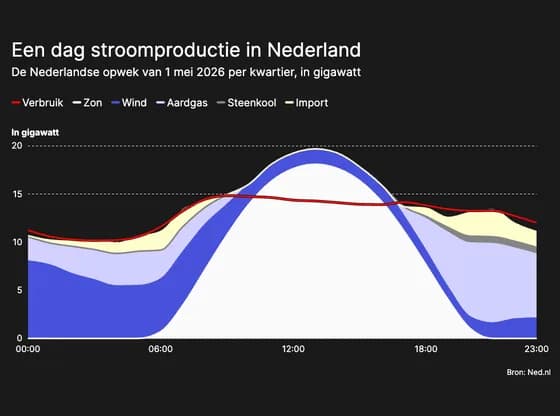 Line, bar and pie chartsEen dag stroomproductie in Nederland
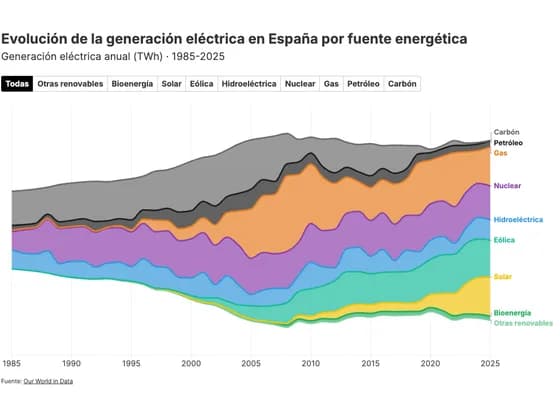 Line, bar and pie chartsEvolución de la generación eléctrica en España por fuente energética
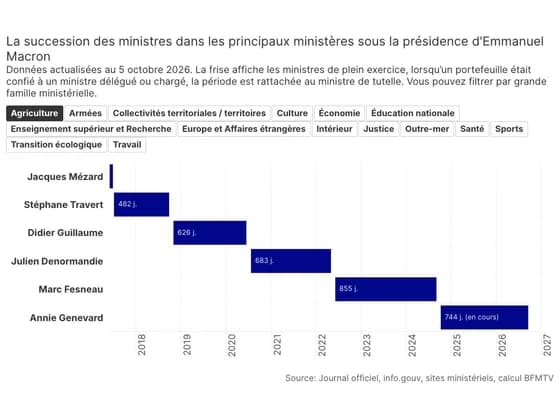 Gantt chartLa succession des ministres dans les principaux ministères sous la présidence d'Emmanuel Macron
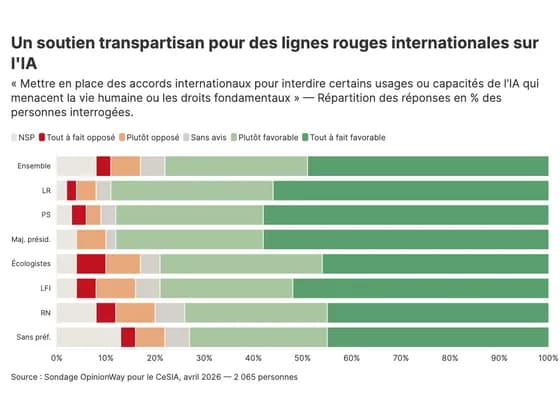 Line, bar and pie chartsUn soutien transpartisan pour des lignes rouges internationales sur l'IA
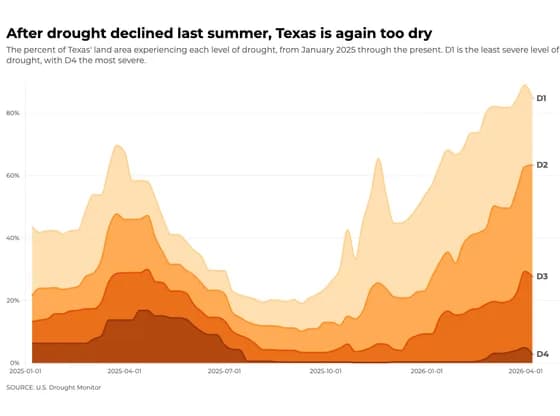 Line, bar and pie chartsAfter drought declined last summer, Texas is again too dry
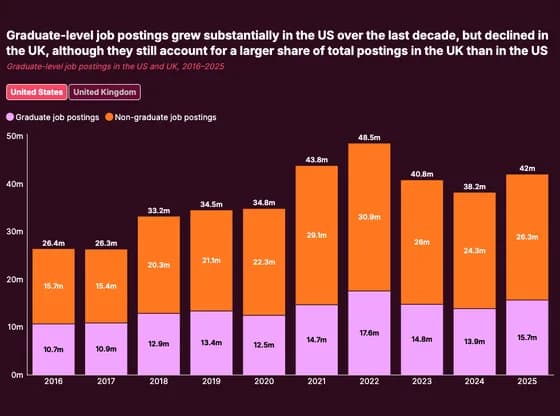 Line, bar and pie chartsGraduate-level job postings grew substantially in the US over the last decade, but declined in…
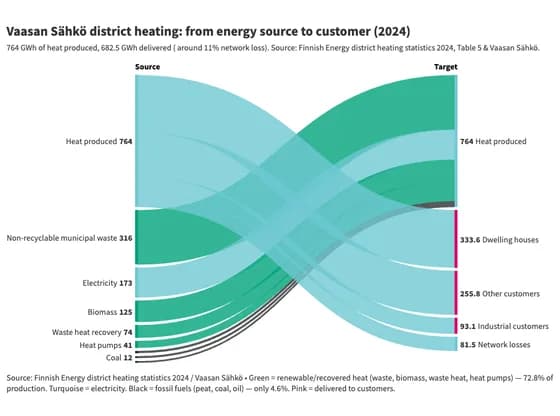 Sankey diagramVaasan Sähkö district heating: from energy source to customer (2024)
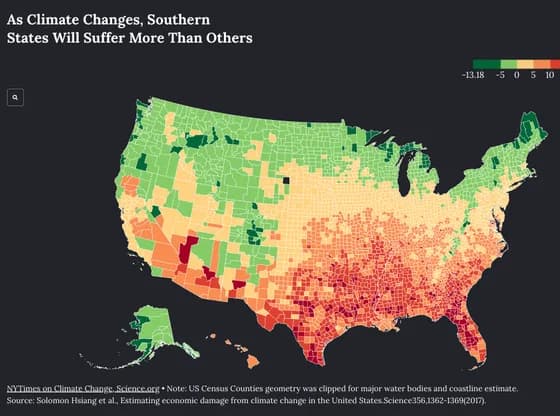 MapsAs Climate Changes, Southern States Will Suffer More Than Others
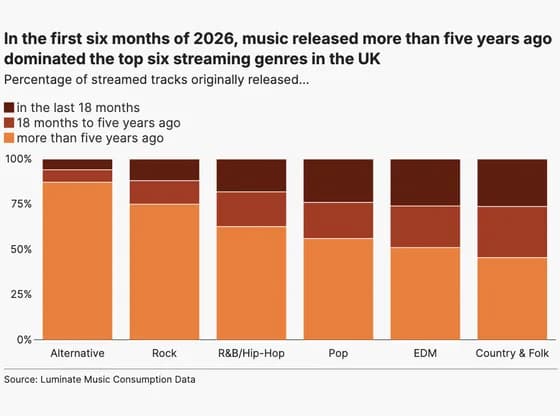 Line, bar and pie chartsIn the first six months of 2026, music released more than five years ago dominated the top six…
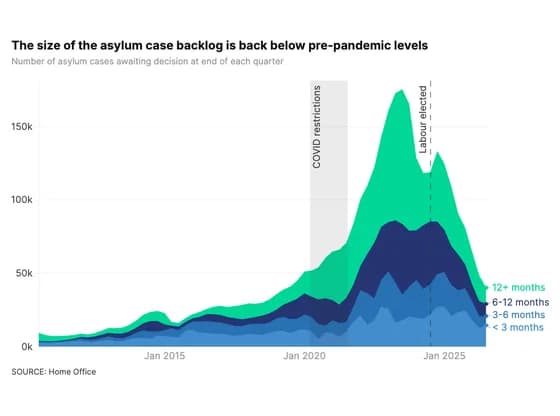 Line, bar and pie chartsThe size of the asylum case backlog is back below pre-pandemic levels
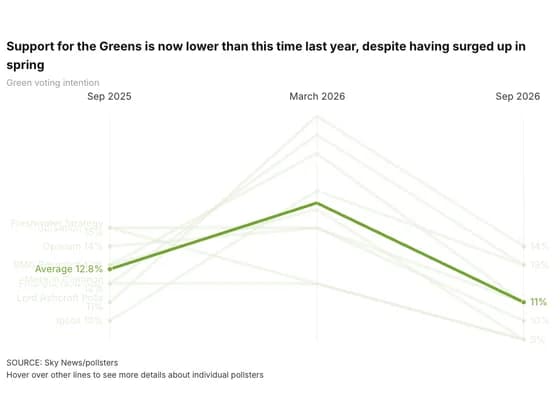 Slope chartSupport for the Greens is now lower than this time last year, despite having surged up in spring
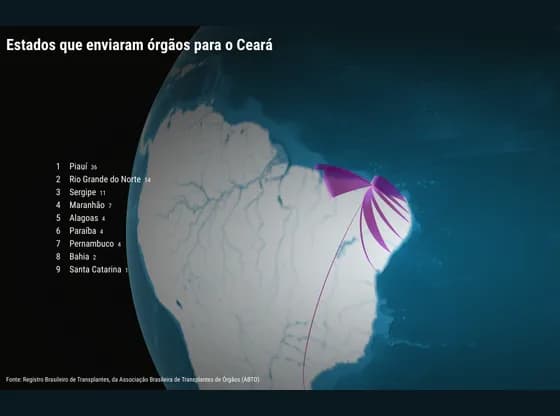 Connections and flow mapsEstados que enviaram órgãos para o Ceará
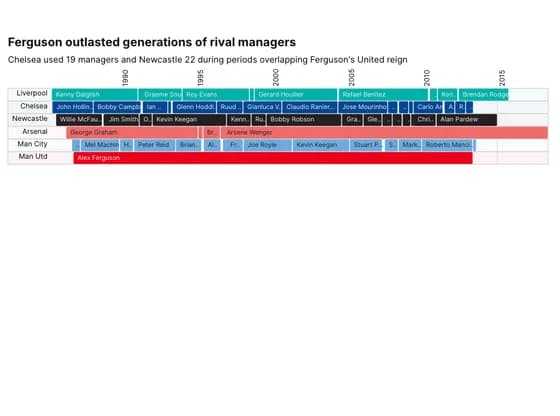 Gantt chartFerguson outlasted generations of rival managers
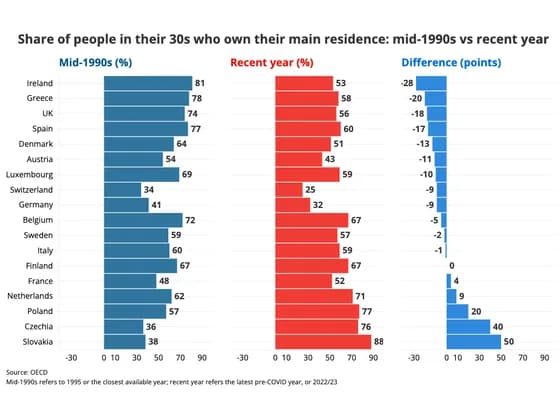 Line, bar and pie chartsShare of people in their 30s who own their main residence: mid-1990s vs recent year
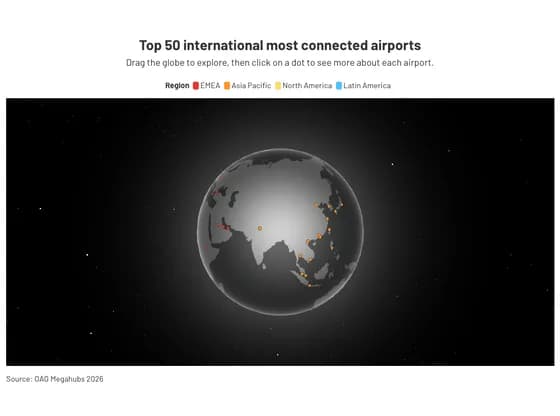 3D globeTop 50 international most connected airports