
Cada gráfico aqui começou como uma planilha.
Mapas, bar chart races, treemaps, pictogramas e mais. Abra um e refaça com os seus dados.
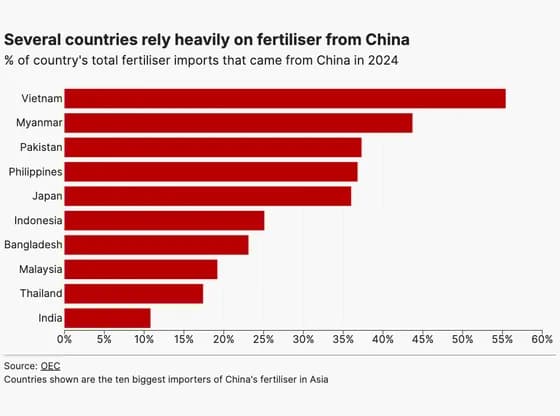 Line, bar and pie chartsSeveral countries rely heavily on fertiliser from China
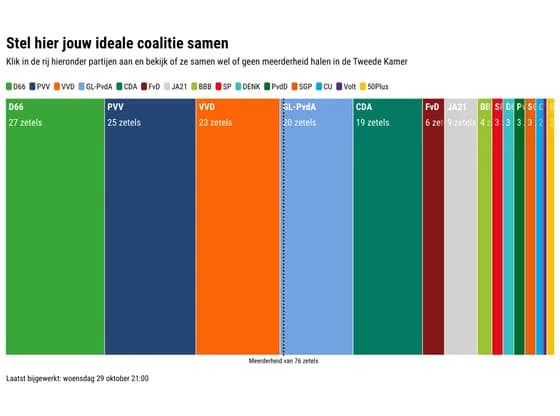 Elections and parliamentsStel hier jouw ideale coalitie samen
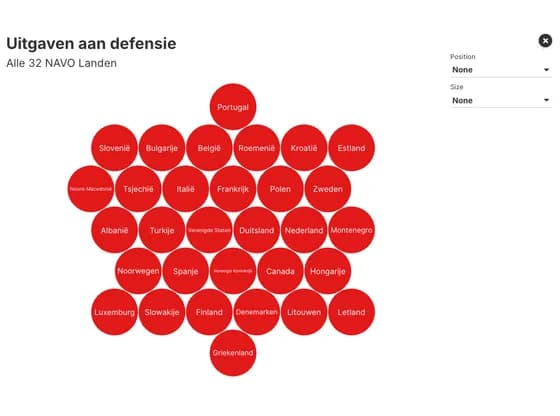 Interactive toolsUitgaven aan defensie
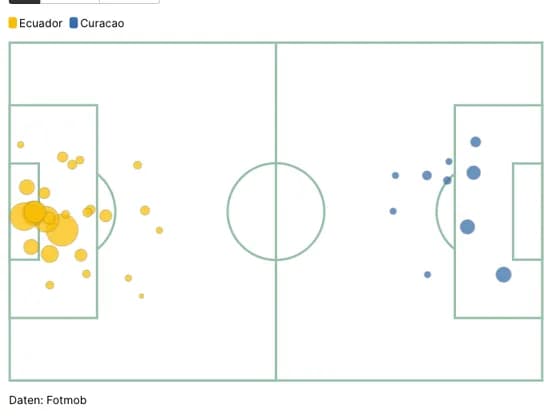 SportsEcuador Chancen vs Curacao
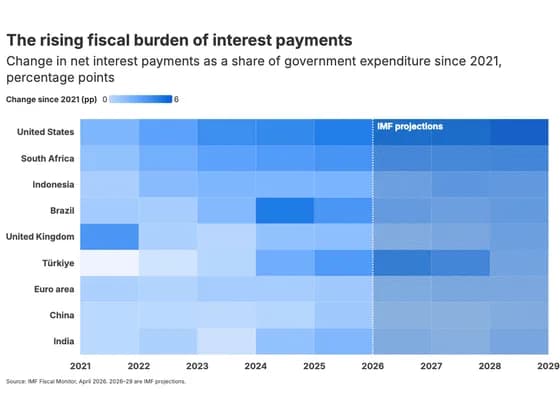 HeatmapThe rising fiscal burden of interest payments
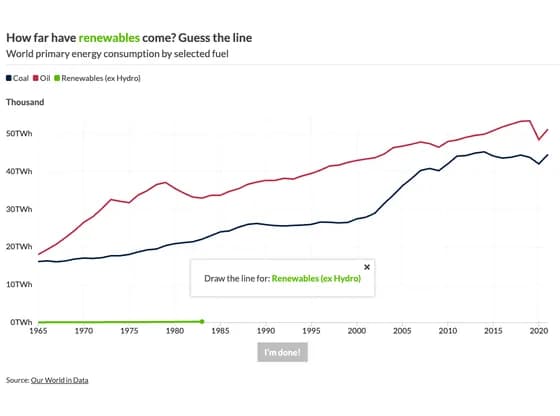 Interactive toolsHow far have renewables come? Guess the line
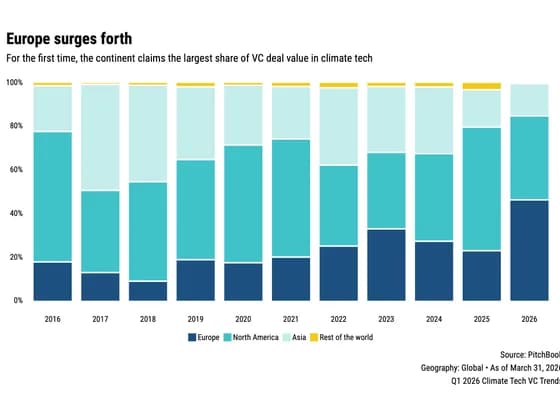 Line, bar and pie chartsEurope surges forth
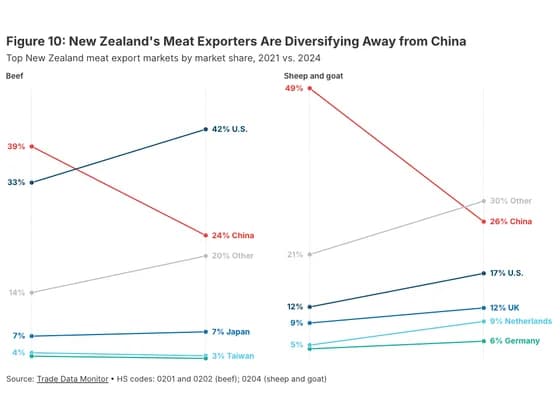 Slope chartFigure 10: New Zealand's Meat Exporters Are Diversifying Away from China
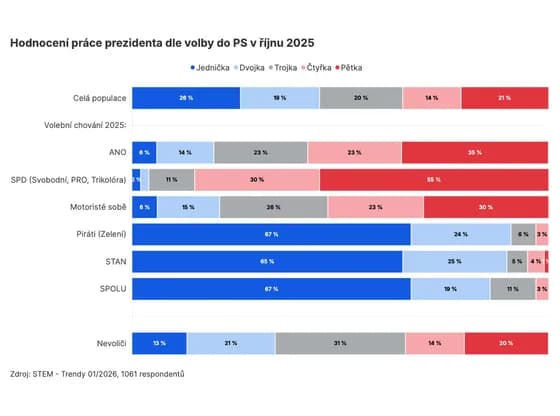 Line, bar and pie chartsHodnocení práce prezidenta dle volby do PS v říjnu 2025
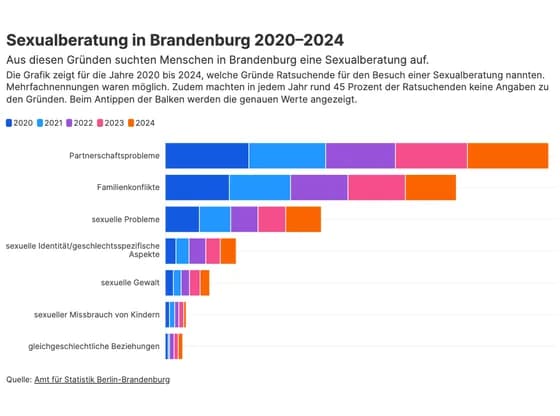 Line, bar and pie chartsSexualberatung in Brandenburg 2020–2024
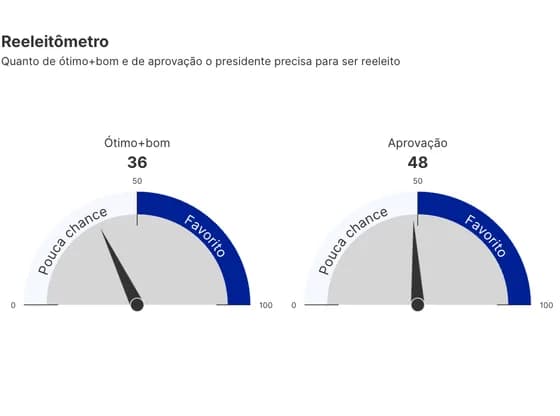 Counters and gaugesReeleitômetro
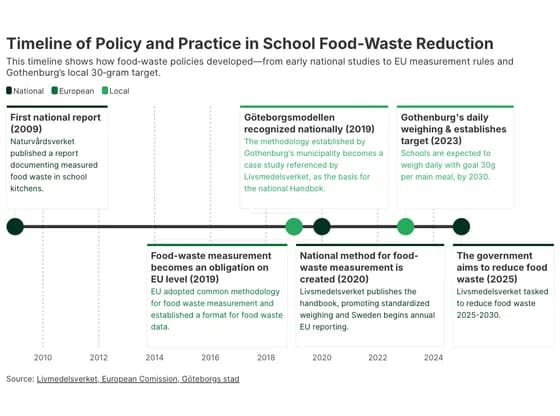 TimelineTimeline of Policy and Practice in School Food‑Waste Reduction
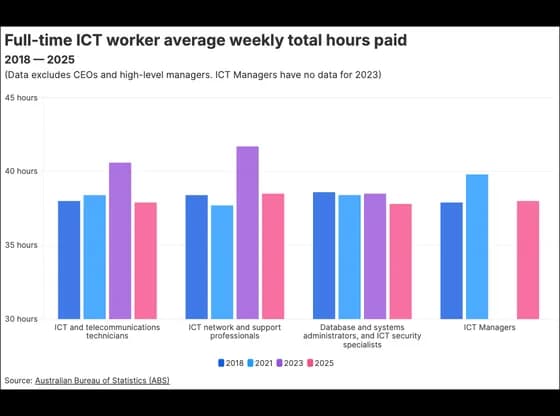 Line, bar and pie chartsFull-time ICT worker average weekly total hours paid
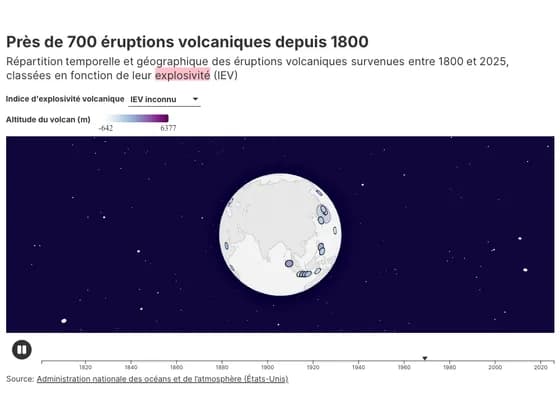 3D globePrès de 700 éruptions volcaniques depuis 1800
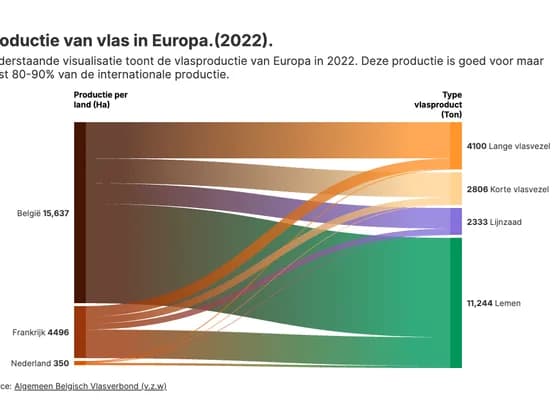 Sankey diagramProductie van vlas in Europa.(2022).
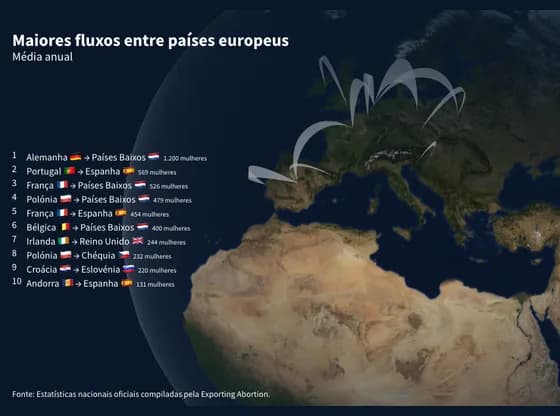 Connections and flow mapsMaiores fluxos entre países europeus
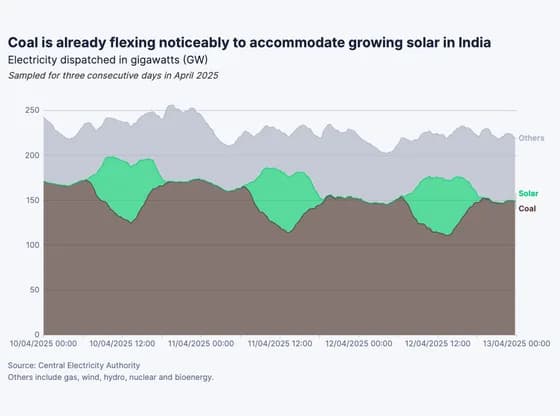 Line, bar and pie chartsCoal is already flexing noticeably to accommodate growing solar in India
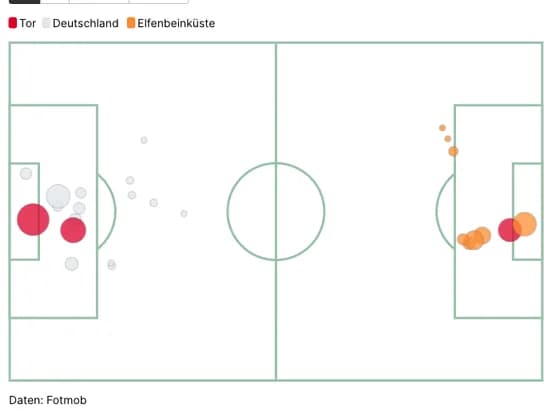 SportsDFB-Team Chancen vs Elfenbeinküste
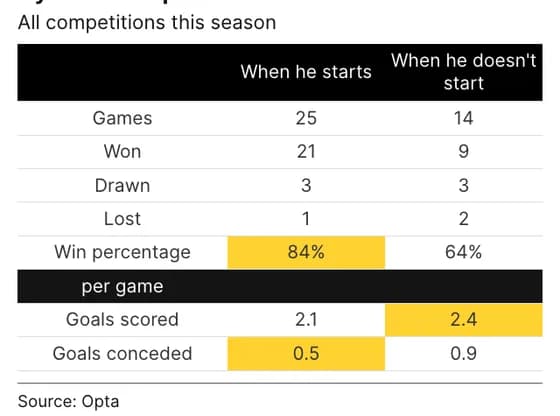 TableGyökeres' impact on Arsenal
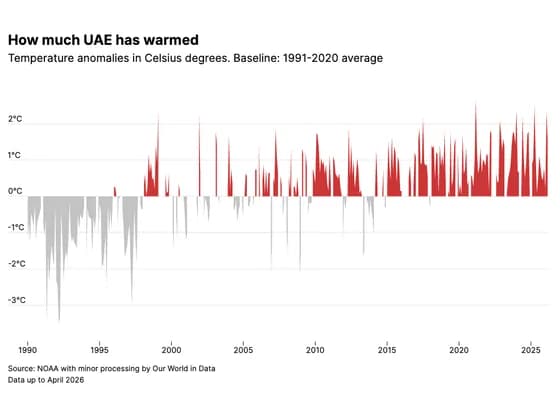 Line, bar and pie chartsHow much UAE has warmed