
Cada gráfico aqui começou como uma planilha.
Mapas, bar chart races, treemaps, pictogramas e mais. Abra um e refaça com os seus dados.
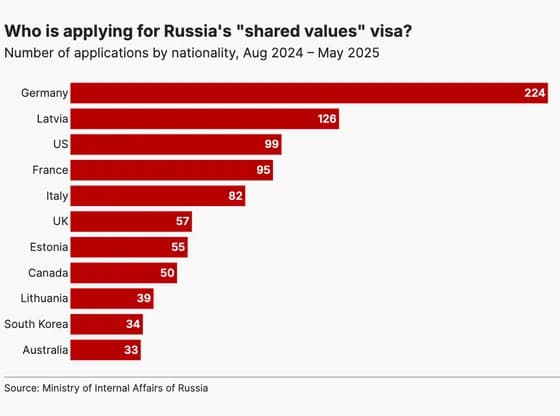 Line, bar and pie chartsWho is applying for Russia's "shared values" visa?
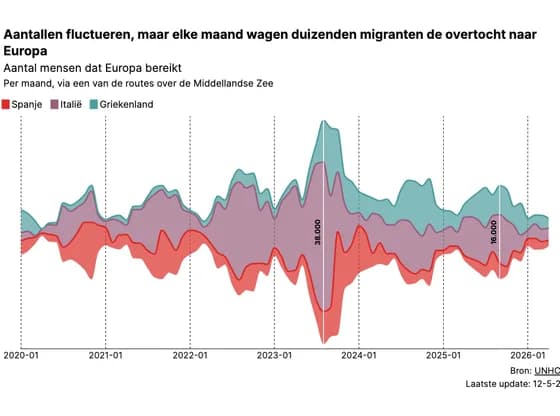 Line, bar and pie chartsAantallen fluctueren, maar elke maand wagen duizenden migranten de overtocht naar Europa
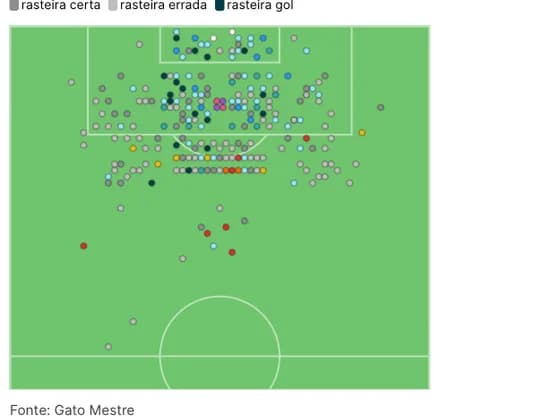 SportsDe onde finalizaram Argentina e Espanha na Copa
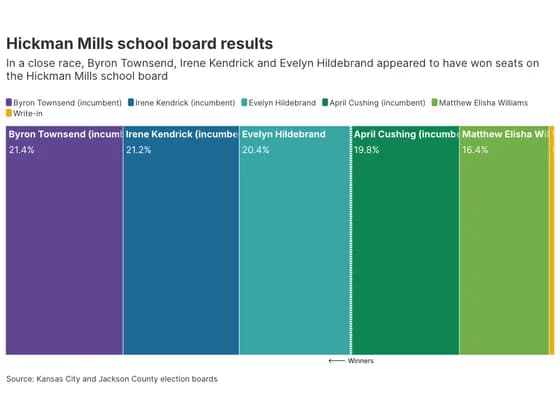 Elections and parliamentsHickman Mills school board results
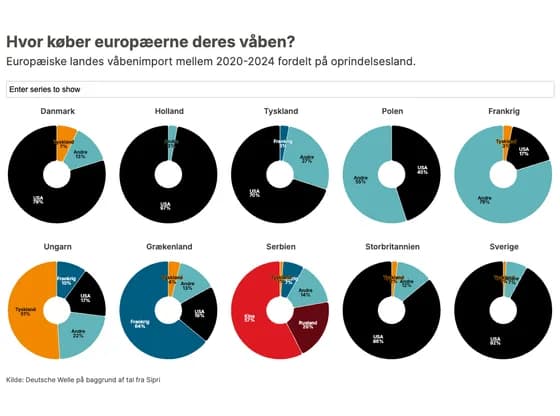 Line, bar and pie chartsHvor køber europæerne deres våben?
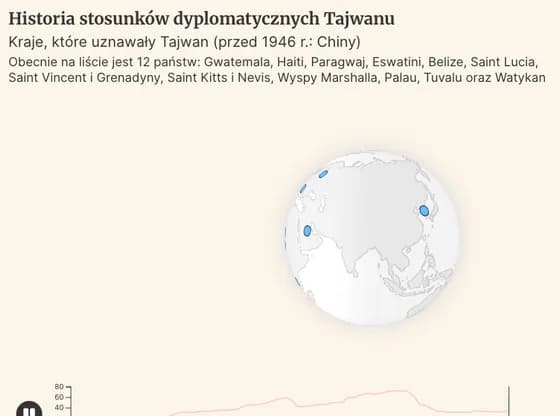 3D globeHistoria stosunków dyplomatycznych Tajwanu
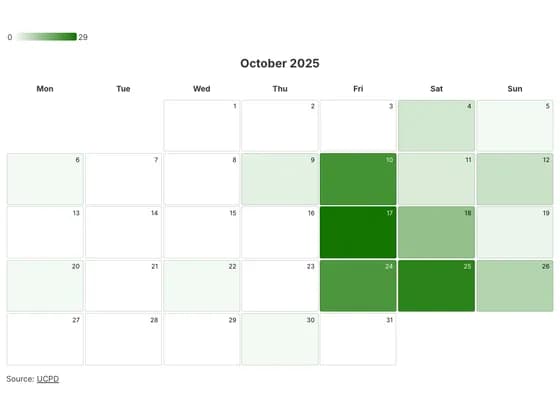 3D plotsOct Alc Chart
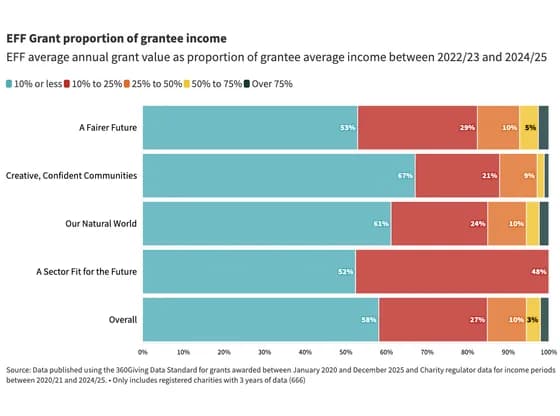 Line, bar and pie chartsEFF Grant proportion of grantee income
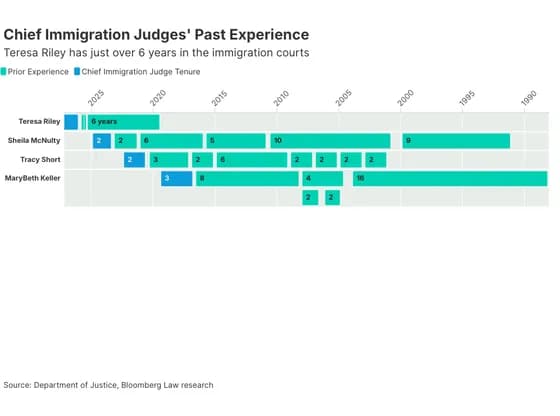 Gantt chartChief Immigration Judges' Past Experience
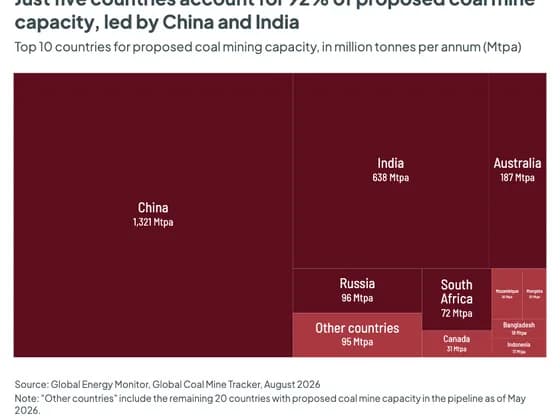 HierarchyJust five countries account for 92% of proposed coal mine capacity, led by China and India
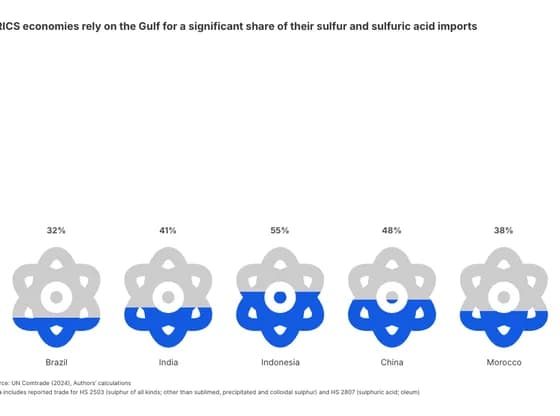 PictogramBRICS economies rely on the Gulf for a significant share of their sulfur and sulfuric acid imports
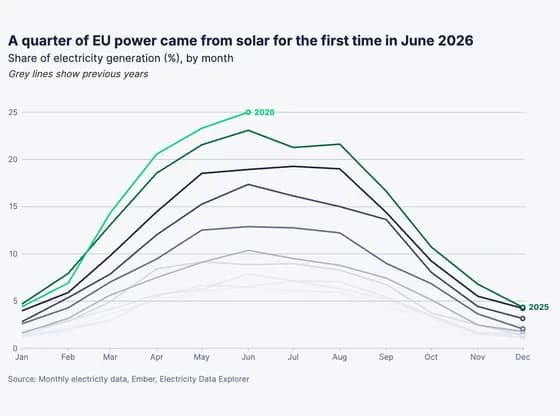 Line, bar and pie chartsA quarter of EU power came from solar for the first time in June 2026
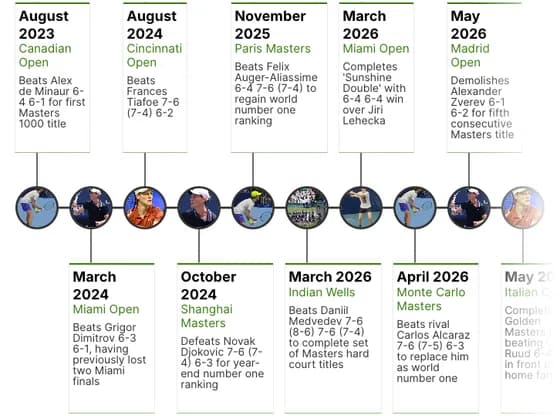 TimelineSinner's Golden Masters timeline
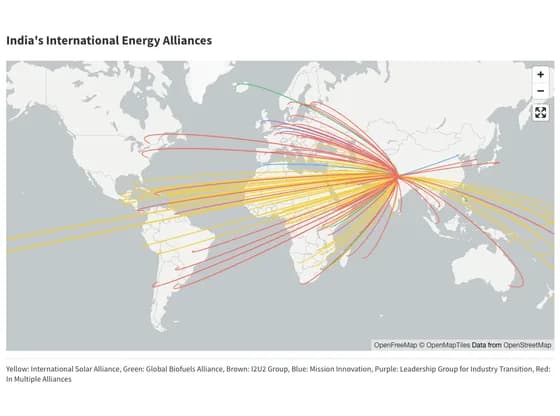 3D mapIndia's International Energy Alliances
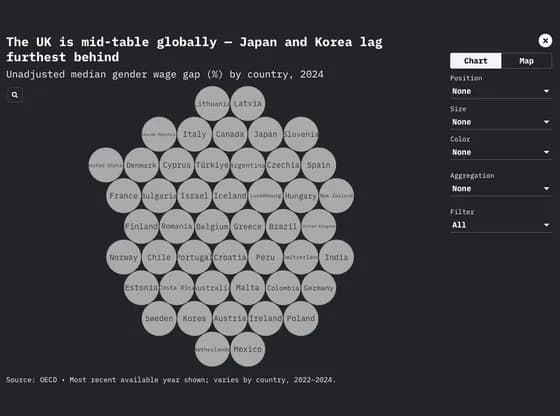 Interactive toolsThe UK is mid-table globally — Japan and Korea lag furthest behind
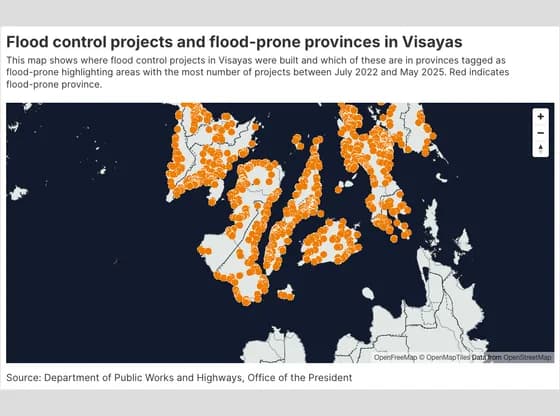 3D mapFlood control projects and flood-prone provinces in Visayas
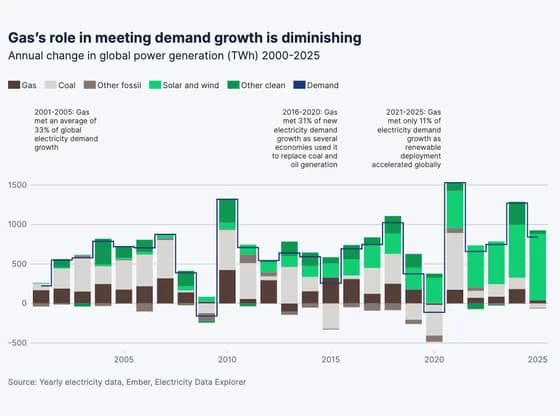 Line, bar and pie chartsGas’s role in meeting demand growth is diminishing
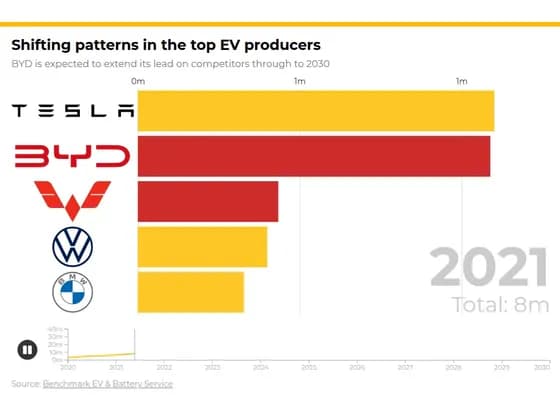 Animated chartsShifting patterns in the top EV producers
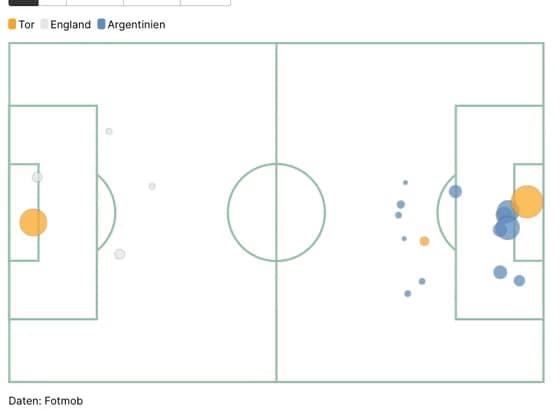 SportsArgentinien Chancen vs England
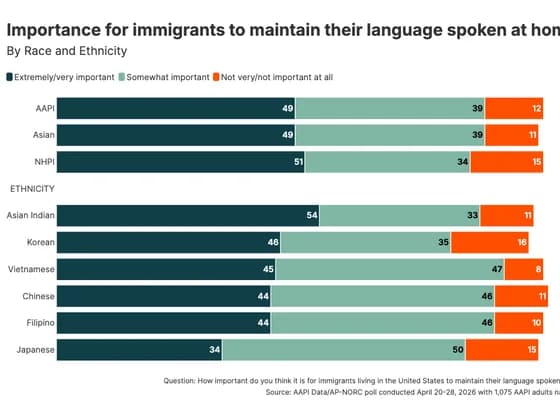 Line, bar and pie chartsImportance for immigrants to maintain their language spoken at home