
Cada gráfico aqui começou como uma planilha.
Mapas, bar chart races, treemaps, pictogramas e mais. Abra um e refaça com os seus dados.
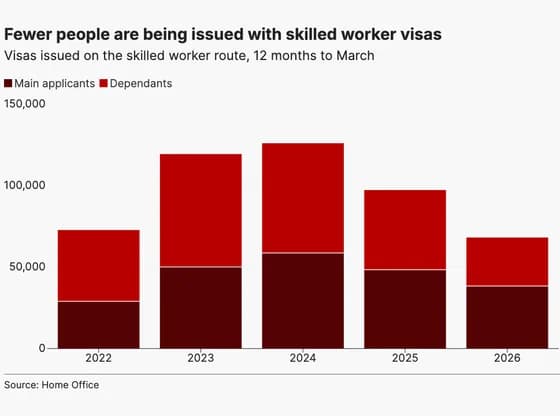 Line, bar and pie chartsFewer people are being issued with skilled worker visas
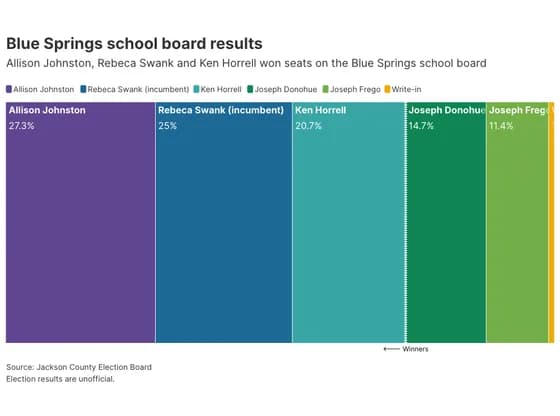 Elections and parliamentsBlue Springs school board results
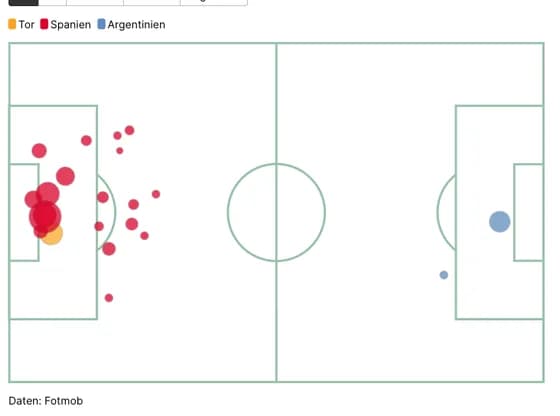 SportsSpanien Chancen vs Argentinien
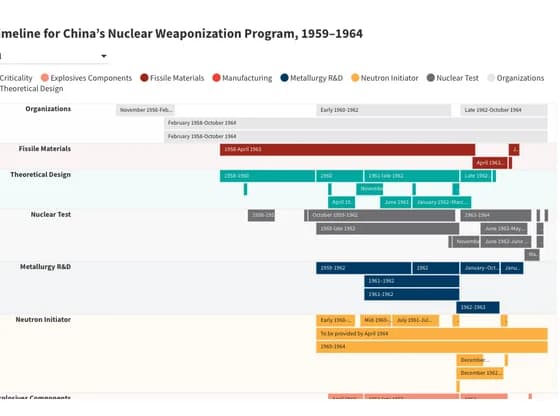 Gantt chartTimeline for China’s Nuclear Weaponization Program, 1959–1964
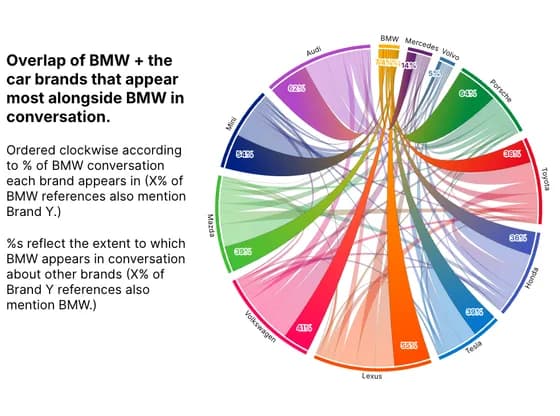 Network graphOverlap of BMW + the car brands that appear most alongside BMW in conversation.
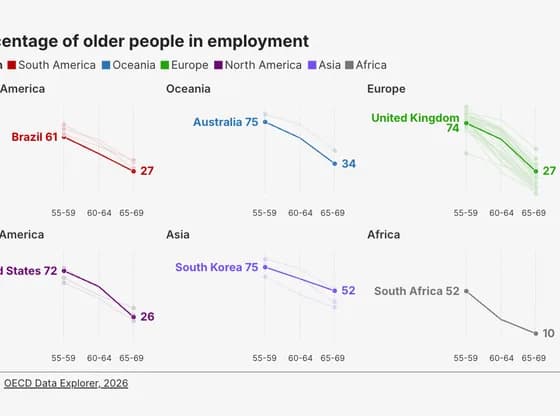 Slope chartPercentage of older people in employment
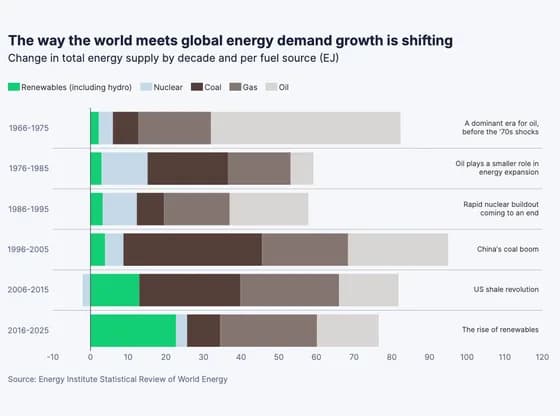 Line, bar and pie chartsThe way the world meets global energy demand growth is shifting
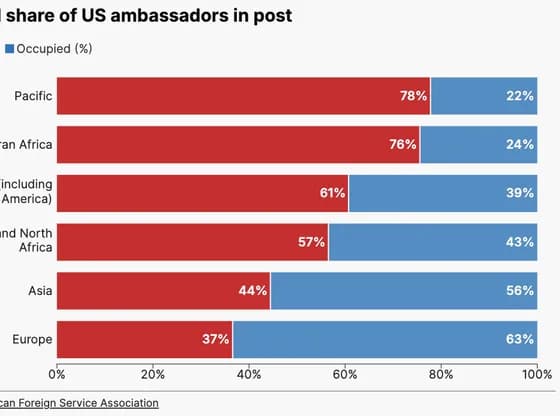 Line, bar and pie chartsRegional share of US ambassadors in post
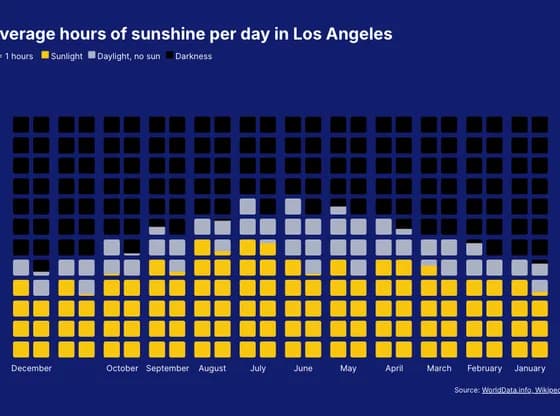 PictogramAverage hours of sunshine per day in Los Angeles
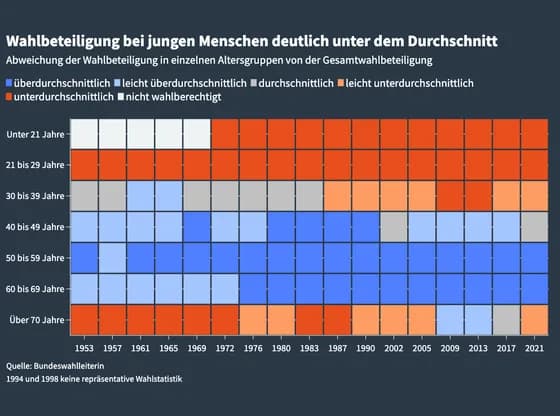 HeatmapWahlbeteiligung bei jungen Menschen deutlich unter dem Durchschnitt
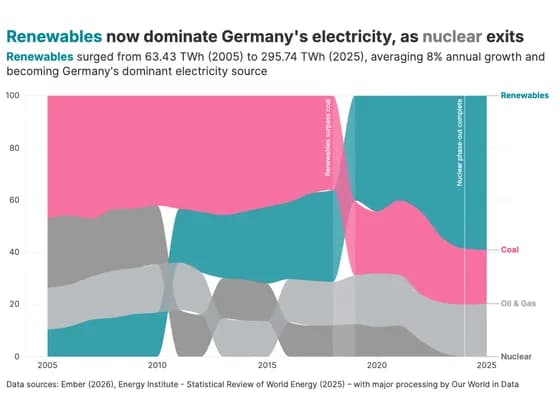 Line, bar and pie chartsRenewables now dominate Germany's electricity, as nuclear exits
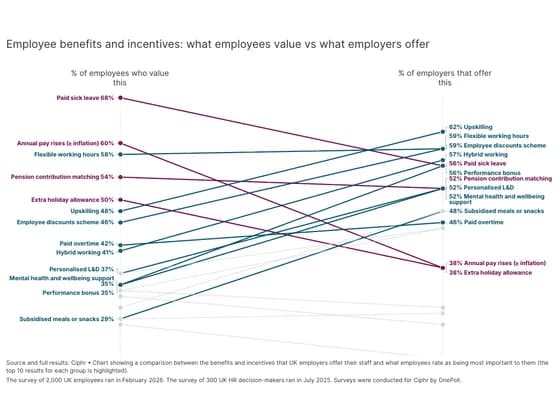 Slope chartEmployee benefits and incentives: what employees value vs what employers offer
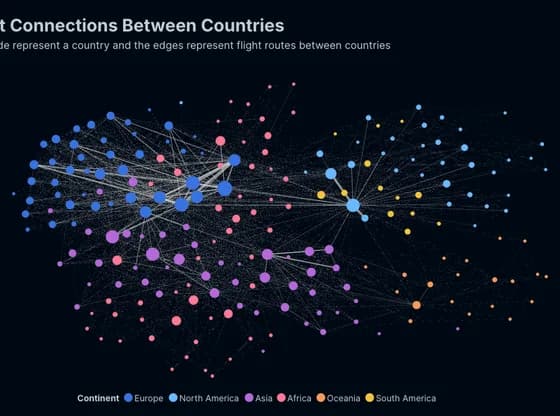 Network graphFlight Connections Between Countries
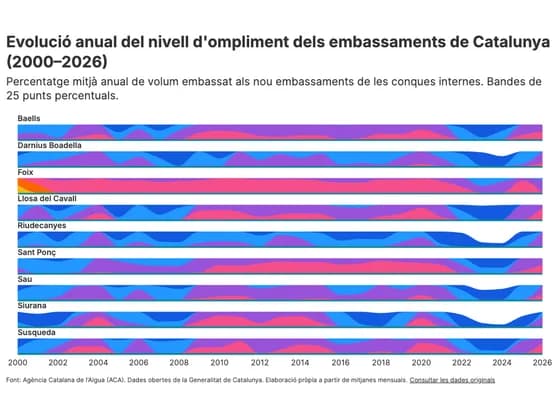 Line, bar and pie chartsEvolució anual del nivell d'ompliment dels embassaments de Catalunya (2000–2026)
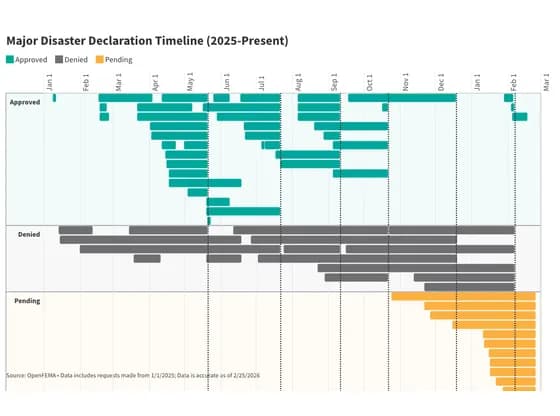 Gantt chartMajor Disaster Declaration Timeline (2025-Present)
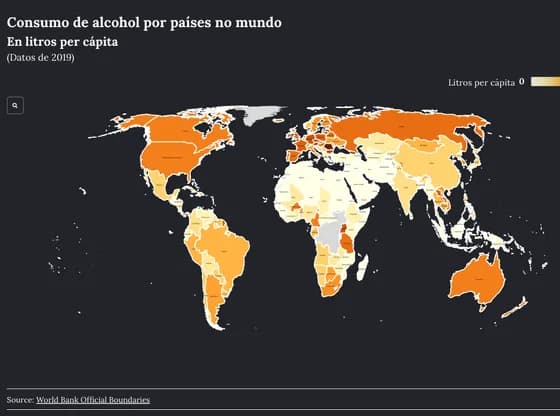 MapsConsumo de alcohol por países no mundo
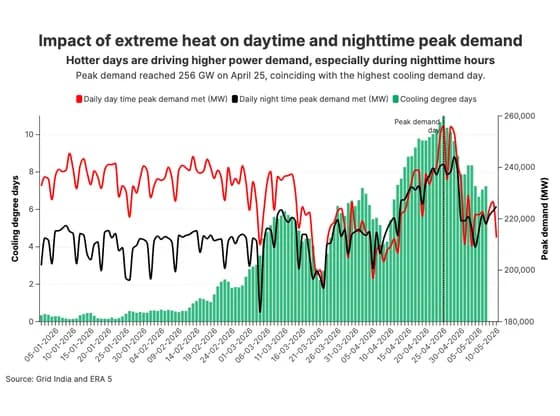 Line, bar and pie chartsImpact of extreme heat on daytime and nighttime peak demand
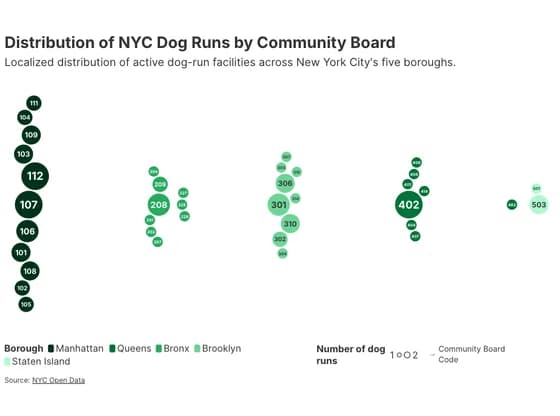 Distribution chartsDistribution of NYC Dog Runs by Community Board
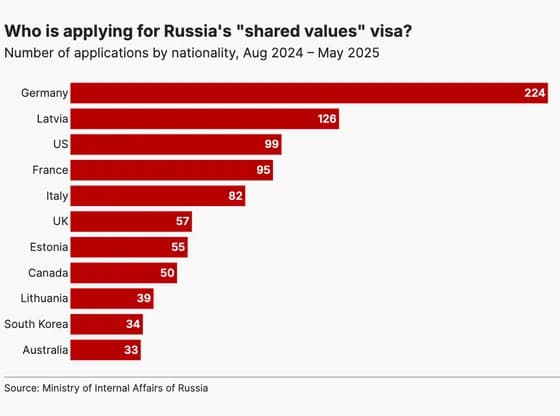 Line, bar and pie chartsWho is applying for Russia's "shared values" visa?
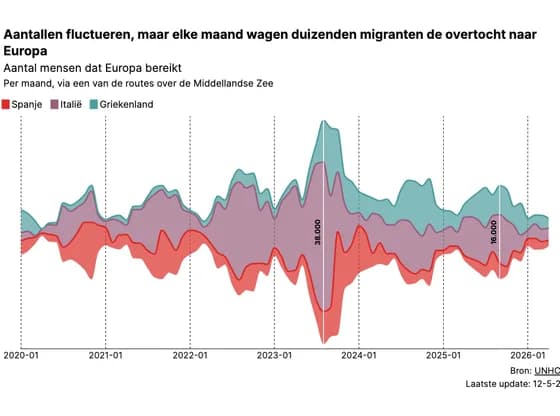 Line, bar and pie chartsAantallen fluctueren, maar elke maand wagen duizenden migranten de overtocht naar Europa