
Cada gráfico aqui começou como uma planilha.
Mapas, bar chart races, treemaps, pictogramas e mais. Abra um e refaça com os seus dados.
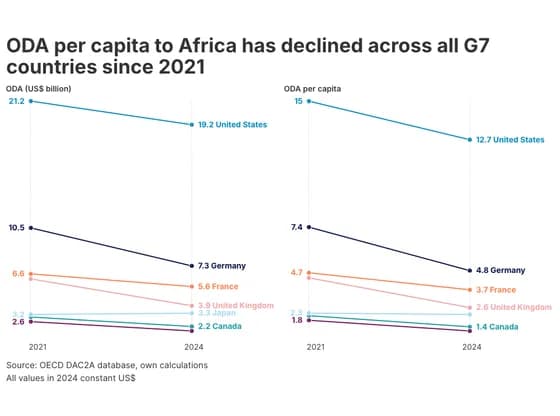 Slope chartODA per capita to Africa has declined across all G7 countries since 2021
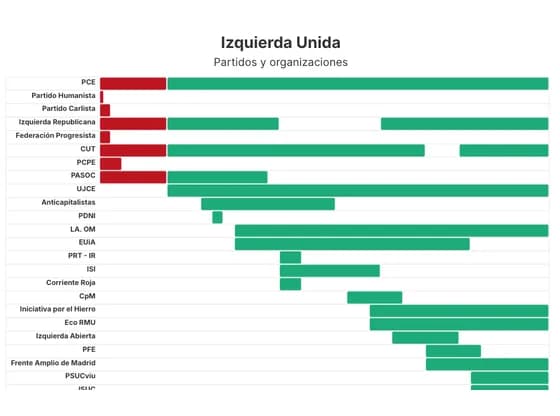 Gantt chartIzquierda Unida
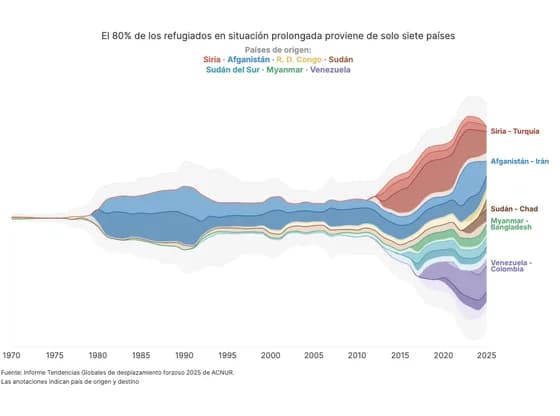 Line, bar and pie chartsEl 80% de los refugiados en situación prolongada proviene de solo siete países
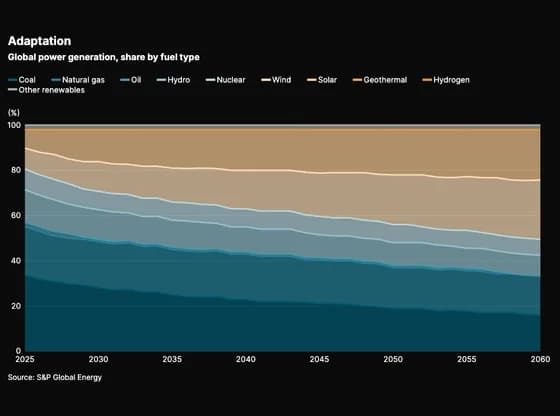 Line, bar and pie chartsAdaptation
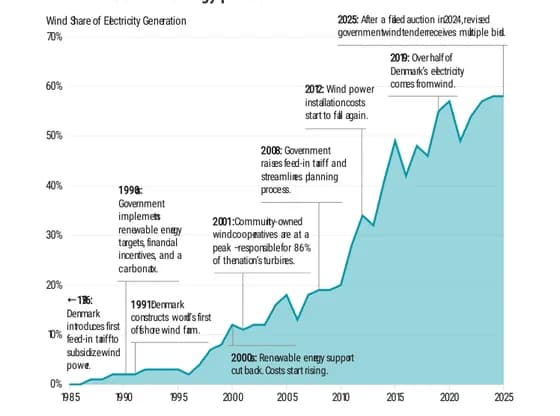 Interactive SVGDenmark is a wind energy pioneer
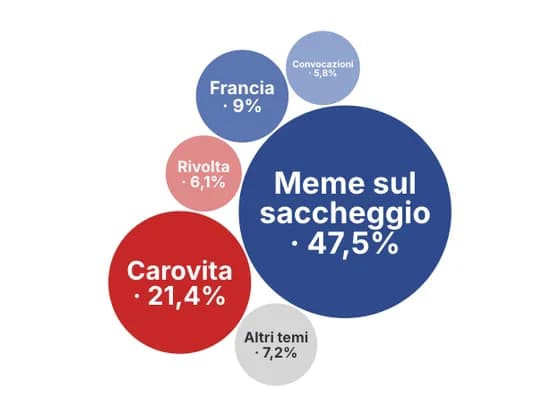 Distribution chartsIl passaparola che ha portato i giovani in piazza
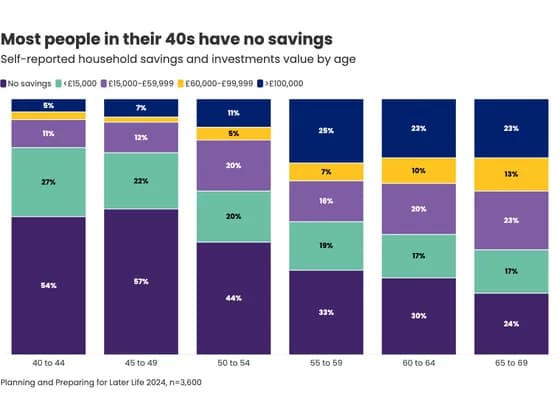 Line, bar and pie chartsMost people in their 40s have no savings
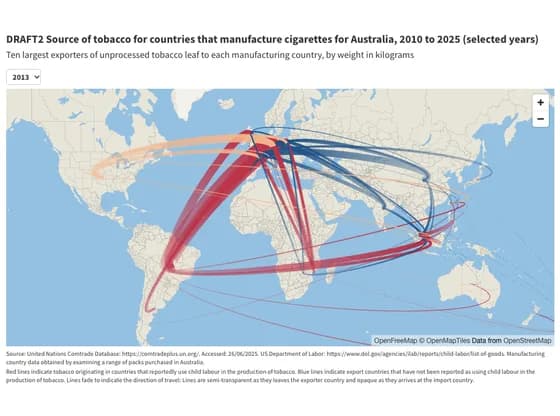 3D mapDRAFT2 Source of tobacco for countries that manufacture cigarettes for Australia, 2010 to 2025…
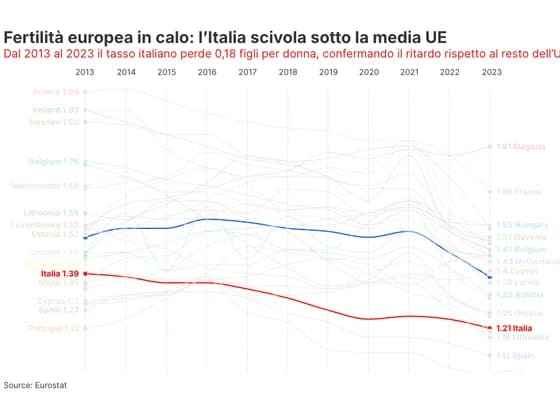 Slope chartFertilità europea in calo: l’Italia scivola sotto la media UE
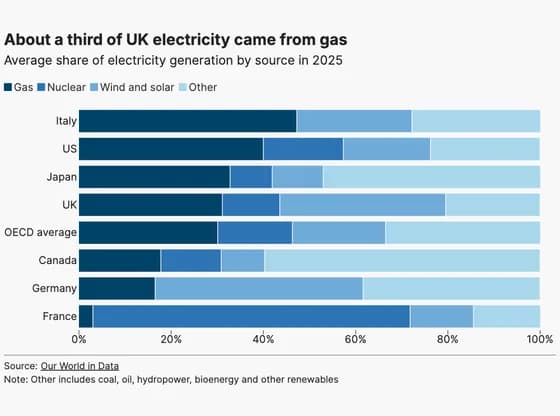 Line, bar and pie chartsAbout a third of UK electricity came from gas
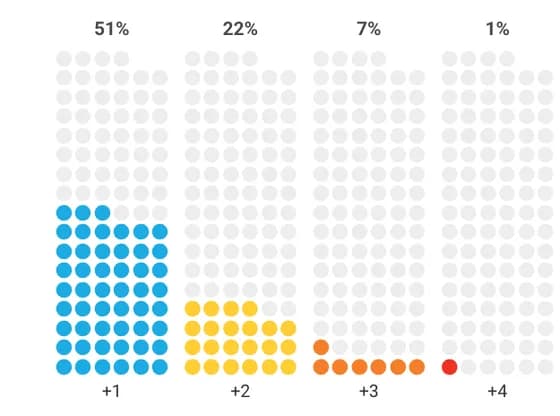 PictogramIf the world wants faster progress, it must focus on the children facing intersecting disadvantages
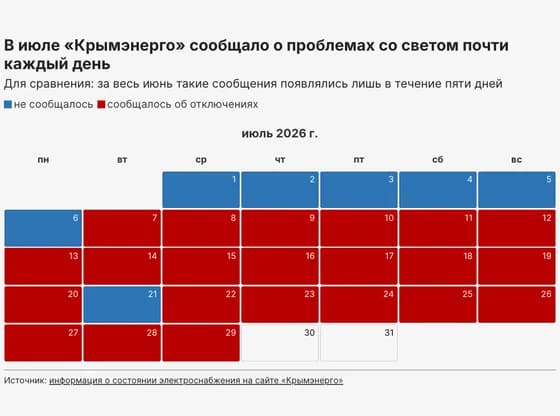 3D plotsВ июле «Крымэнерго» сообщало о проблемах со светом почти каждый день
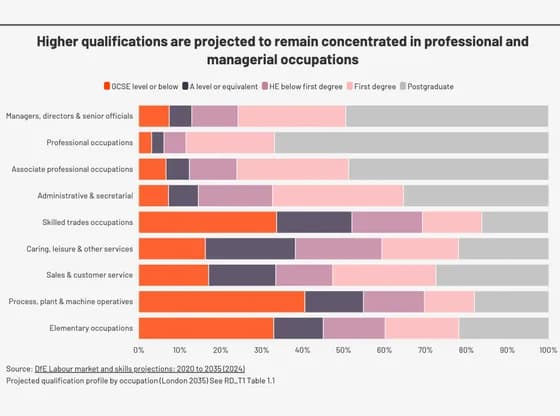 Line, bar and pie chartsHigher qualifications are projected to remain concentrated in professional and managerial…
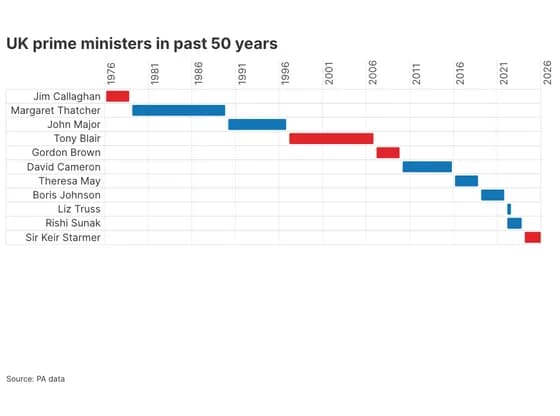 Gantt chartUK prime ministers in past 50 years
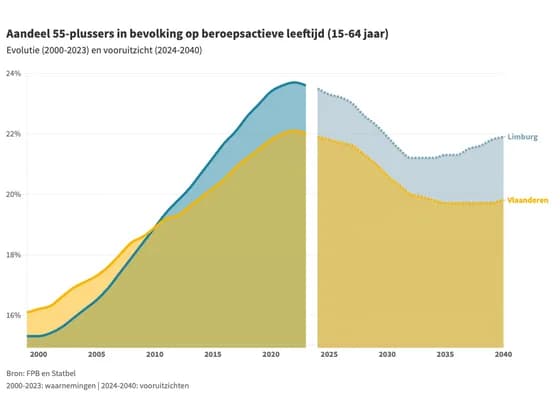 Line, bar and pie chartsAandeel 55-plussers in bevolking op beroepsactieve leeftijd (15-64 jaar)
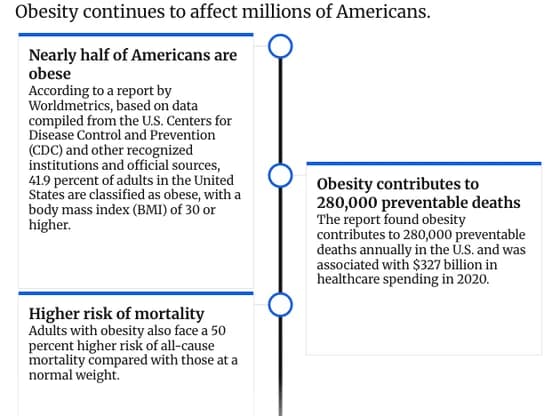 TimelineObesity Remains a Major Health Challenge in the U.S.
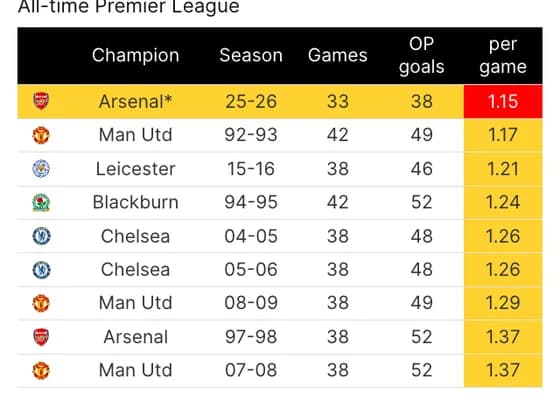 TableArsenal are on course to be the lowest-scoring champions from open play ever
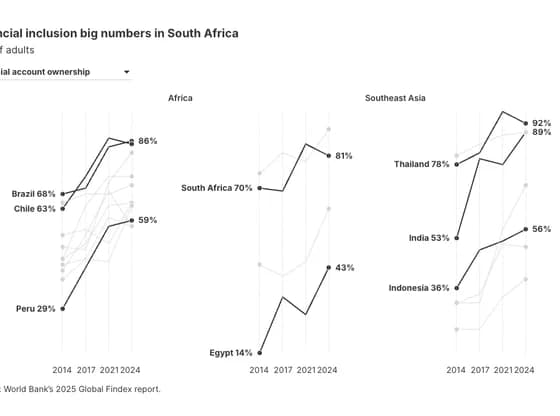 Slope chartFinancial inclusion big numbers in South Africa
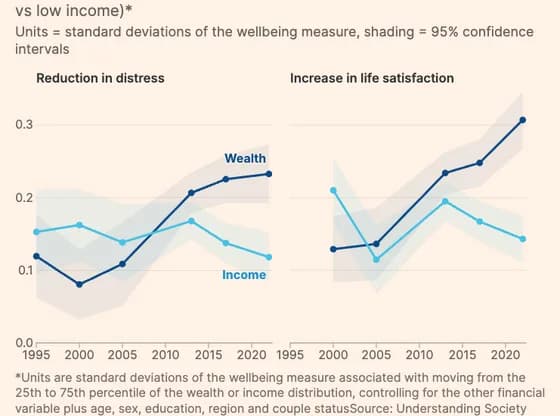 Line, bar and pie chartsIncome used to matter more for wellbeing; now wealth dominates
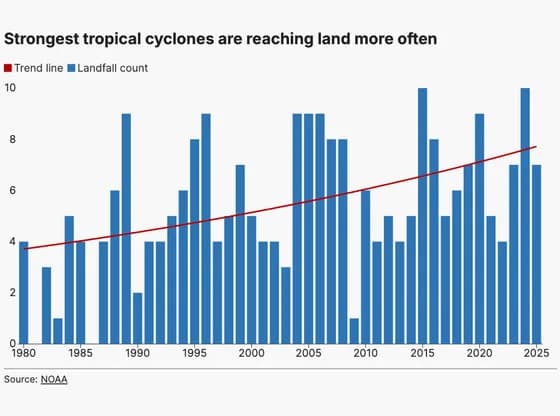 Line, bar and pie chartsStrongest tropical cyclones are reaching land more often