
Cada gráfico aqui começou como uma planilha.
Mapas, bar chart races, treemaps, pictogramas e mais. Abra um e refaça com os seus dados.
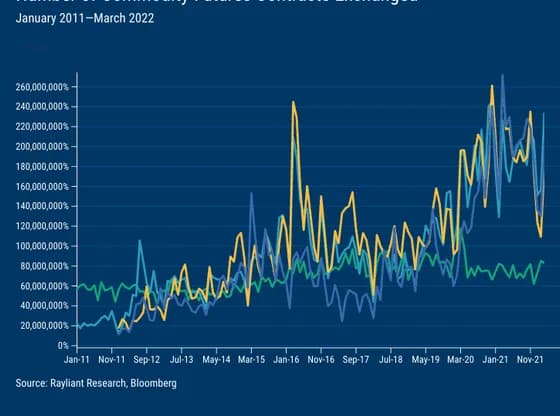 Animated chartsChina Commodity Markets Amongst World's Best
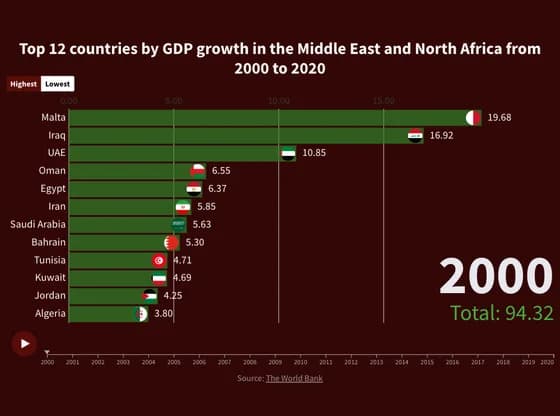 Animated chartsTop 12 countries by GDP growth in the Middle East and North Africa from 2000 to 2020
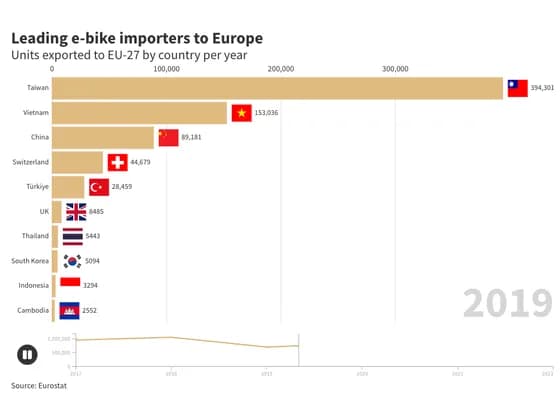 Animated chartsLeading e-bike importers to Europe
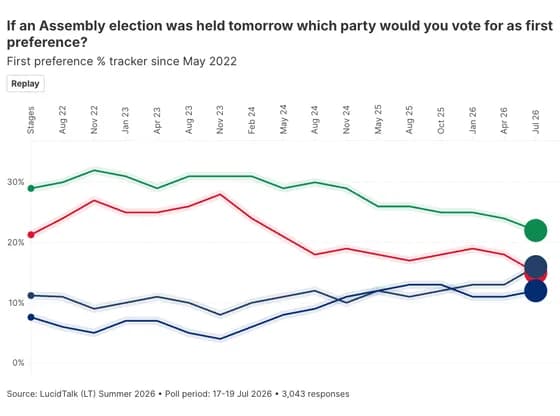 Animated chartsIf an Assembly election was held tomorrow which party would you vote for as first preference?
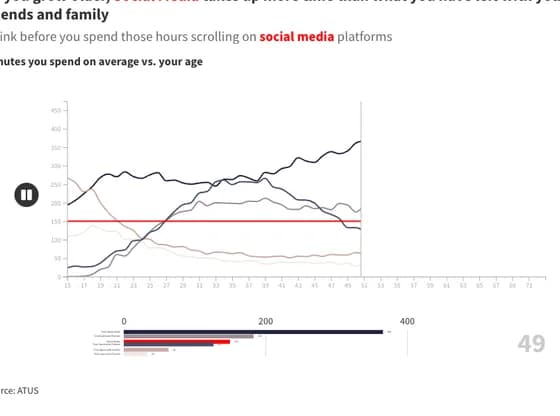 Animated chartsAs you grow older, Social Media takes up more time than what you have left with your friends and…
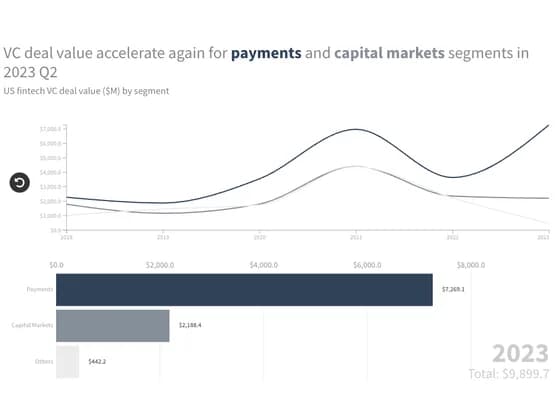 Animated chartsVC deal value accelerate again for payments and capital markets segments in 2023 Q2
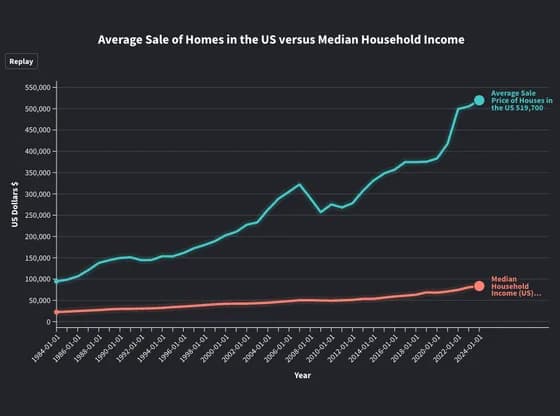 Animated chartsAverage Sale of Homes in the US versus Median Household Income
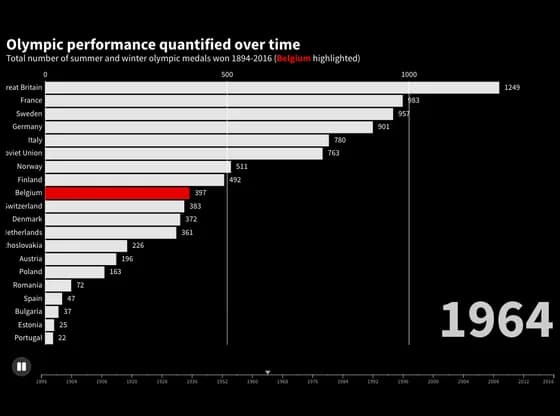 Animated chartsOlympic performance quantified over time
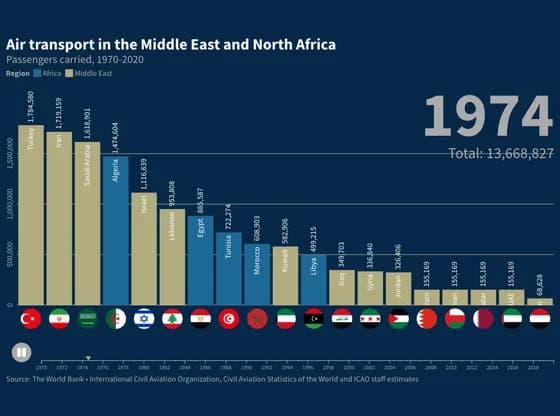 Animated chartsAir transport in the Middle East and North Africa
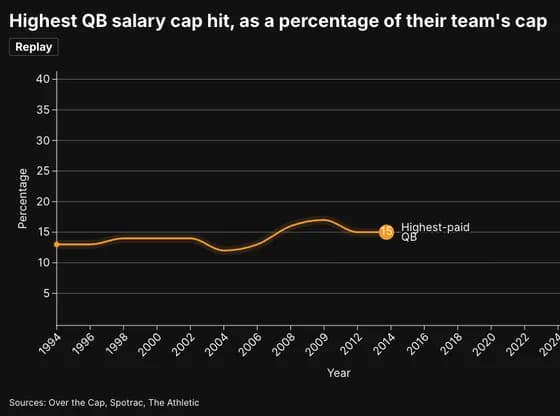 Animated chartsHighest QB salary cap hit, as a percentage of their team's cap
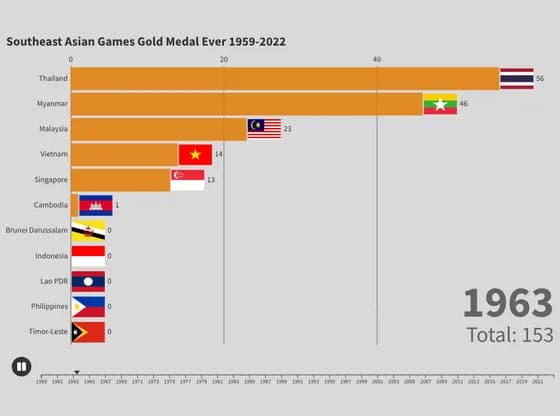 Animated chartsSoutheast Asian Games Gold Medal Ever 1959-2022
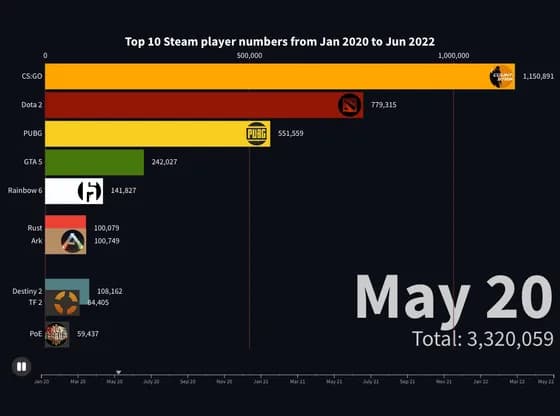 Animated chartsTop 10 Steam player numbers from Jan 2020 to Jun 2022
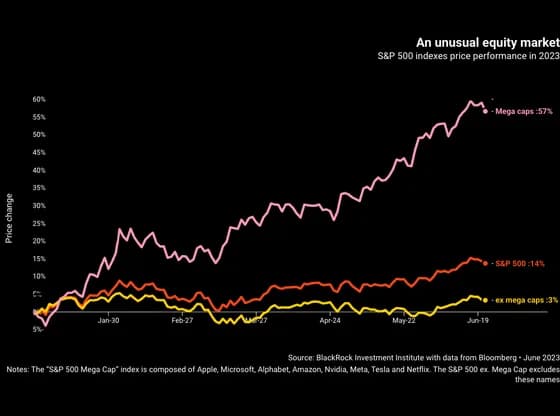 Animated chartsAn unusual equity market
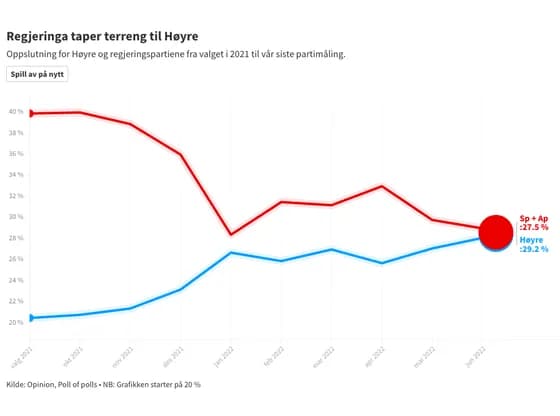 Animated chartsRegjeringa taper terreng til Høyre
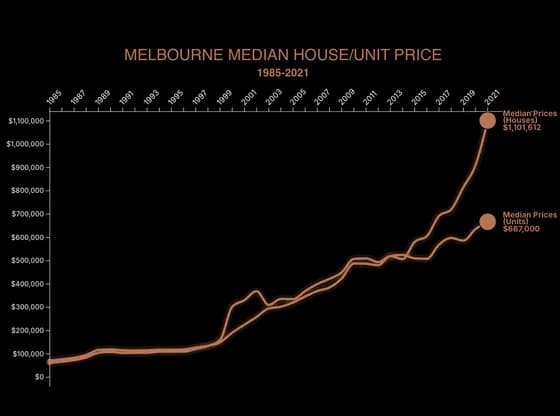 Animated chartsMELBOURNE MEDIAN HOUSE/UNIT PRICE