
Cada gráfico aqui começou como uma planilha.
Mapas, bar chart races, treemaps, pictogramas e mais. Abra um e refaça com os seus dados.
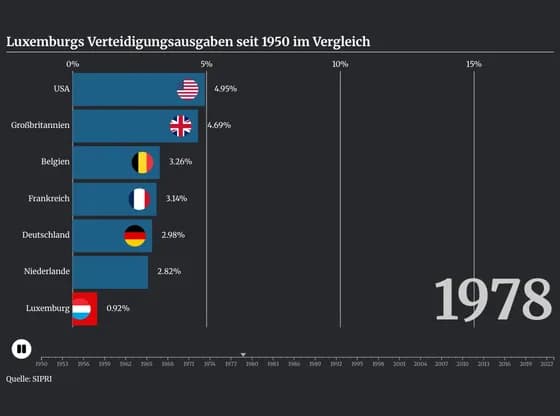 Animated chartsLuxemburgs Verteidigungsausgaben seit 1950 im Vergleich
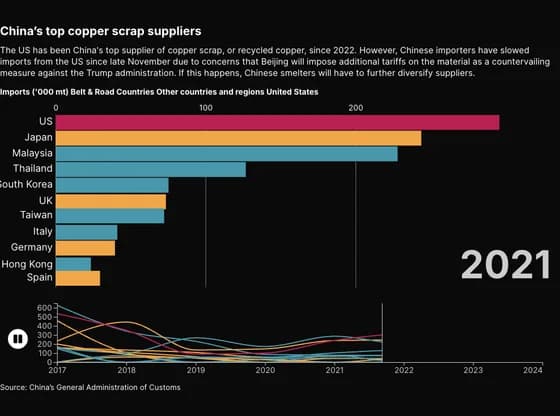 Animated chartsChina’s top copper scrap suppliers
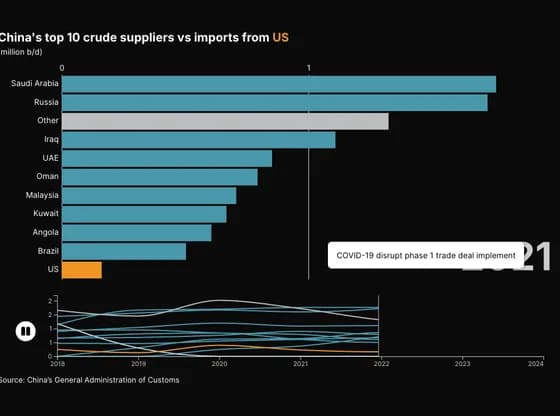 Animated chartsChina's top 10 crude suppliers vs imports from US
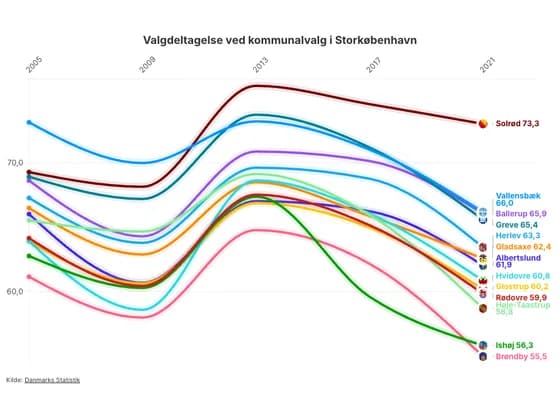 Animated chartsValgdeltagelse ved kommunalvalg i Storkøbenhavn
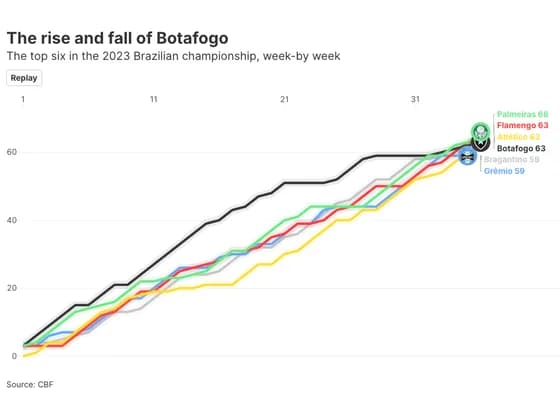 Animated chartsThe rise and fall of Botafogo
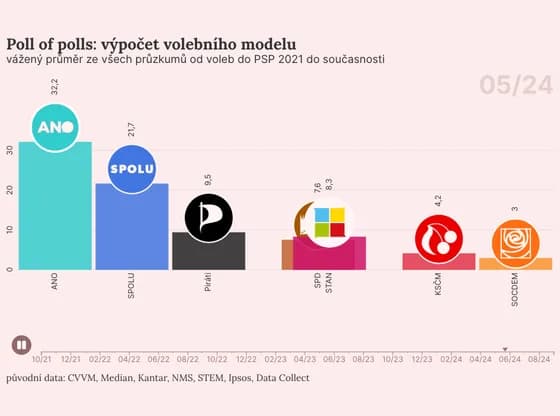 Animated chartsPoll of polls: výpočet volebního modelu
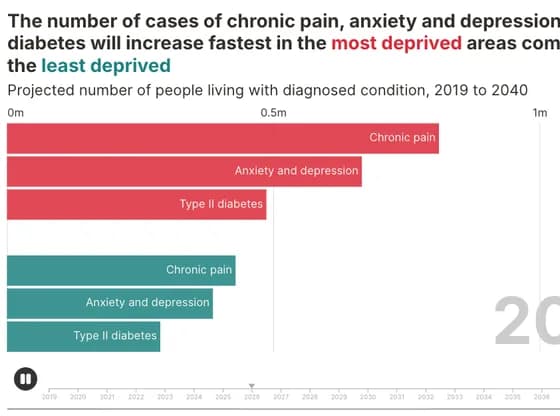 Animated chartsThe number of cases of chronic pain, anxiety and depression and diabetes will increase fastest…
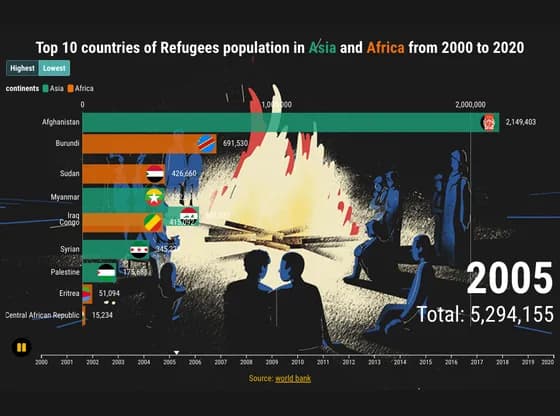 Animated chartsTop 10 countries of Refugees population in Asia and Africa from 2000 to 2020
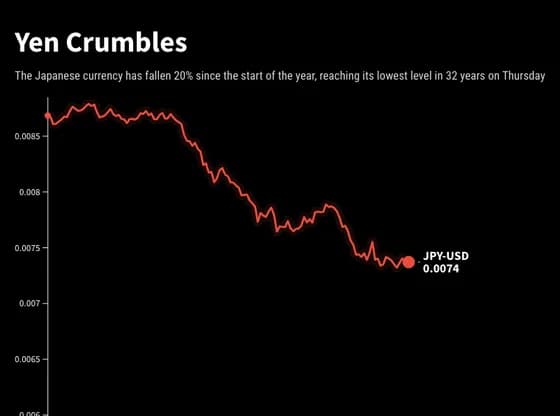 Animated chartsYen Crumbles
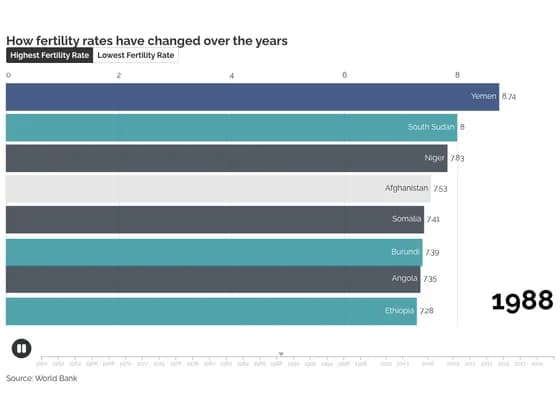 Animated chartsHow fertility rates have changed over the years
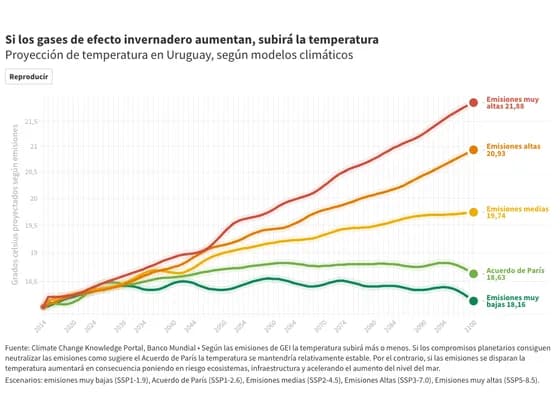 Animated chartsSi los gases de efecto invernadero aumentan, subirá la temperatura
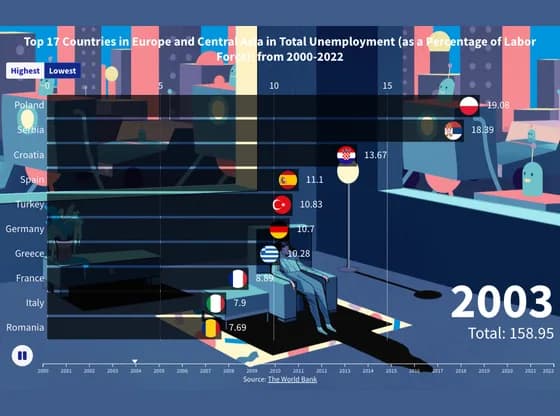 Animated chartsTop 17 Countries in Europe and Central Asia in Total Unemployment (as a Percentage of Labor…
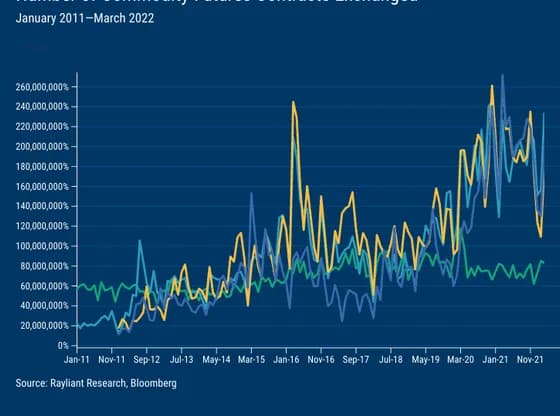 Animated chartsChina Commodity Markets Amongst World's Best
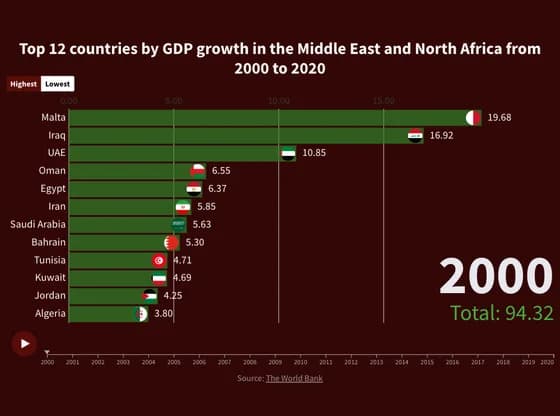 Animated chartsTop 12 countries by GDP growth in the Middle East and North Africa from 2000 to 2020
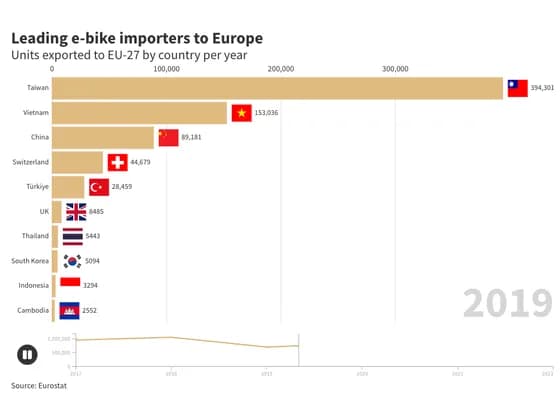 Animated chartsLeading e-bike importers to Europe
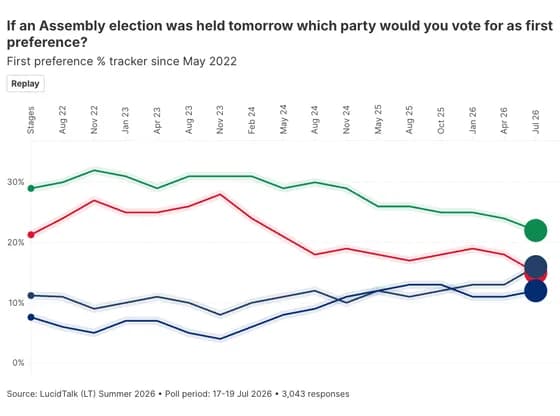 Animated chartsIf an Assembly election was held tomorrow which party would you vote for as first preference?
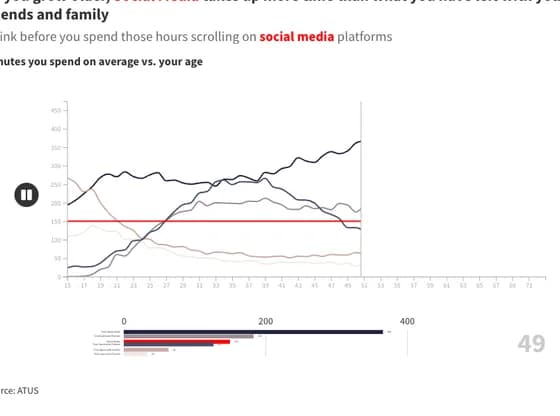 Animated chartsAs you grow older, Social Media takes up more time than what you have left with your friends and…
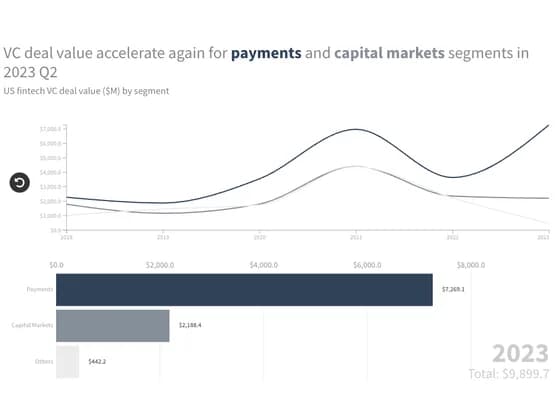 Animated chartsVC deal value accelerate again for payments and capital markets segments in 2023 Q2
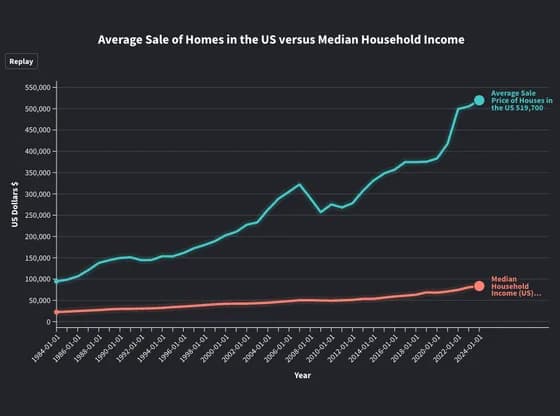 Animated chartsAverage Sale of Homes in the US versus Median Household Income
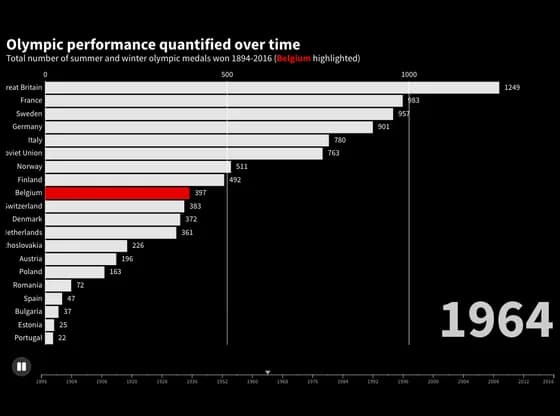 Animated chartsOlympic performance quantified over time