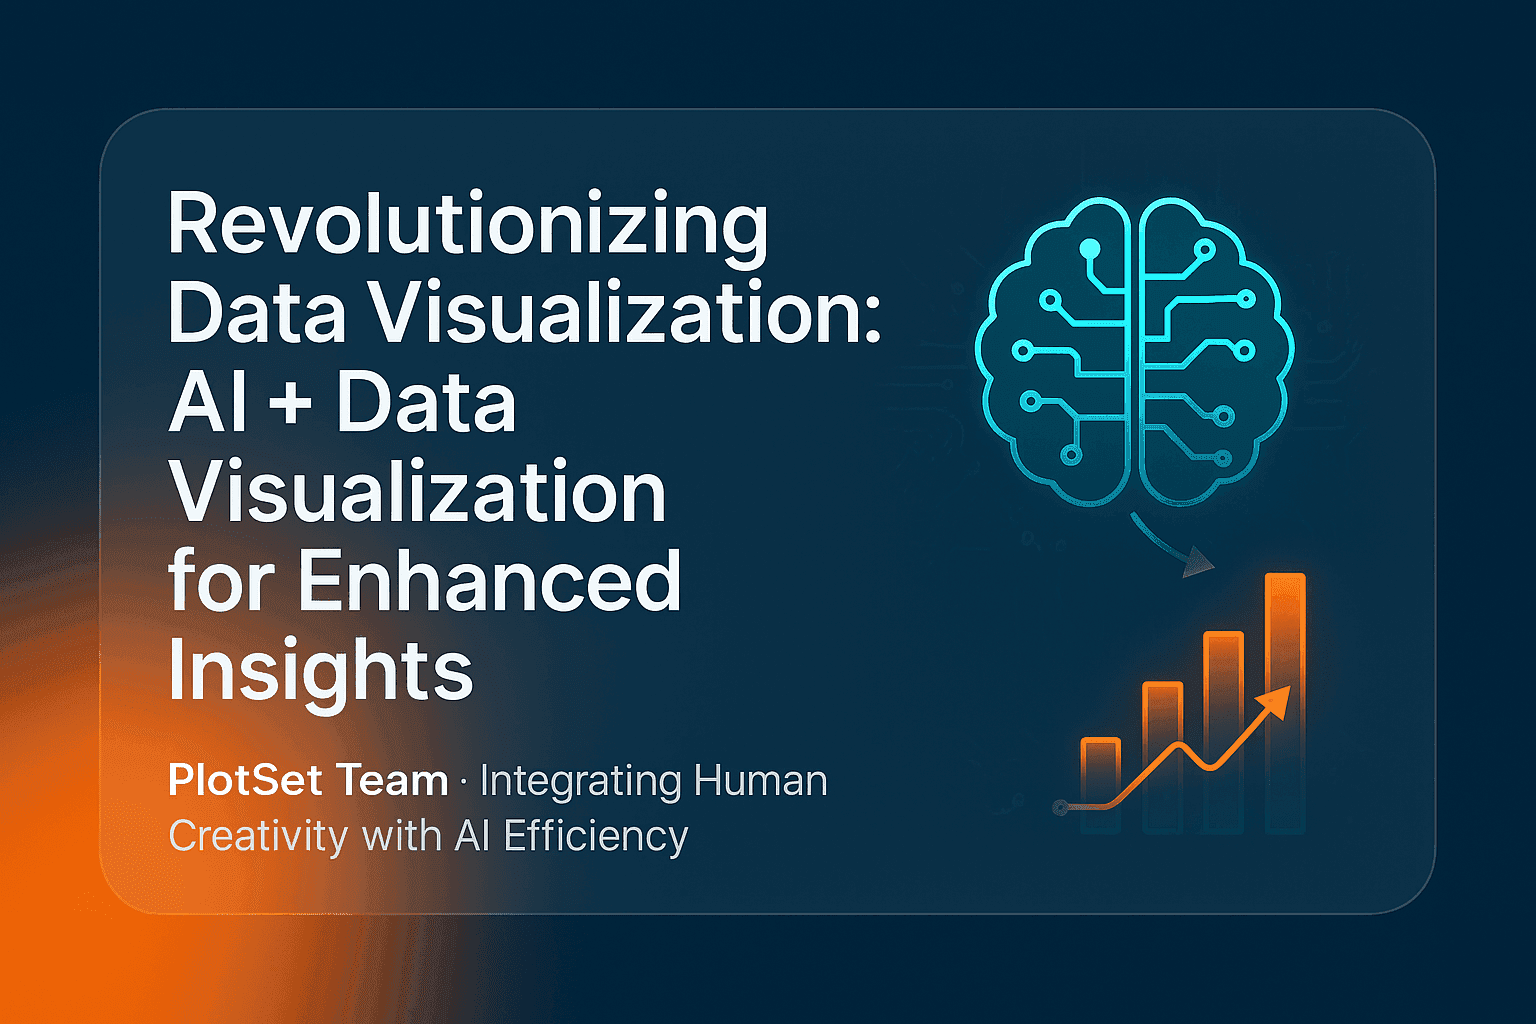
AI and data visualization now meet in a practical place: an AI agent that cleans a table, picks a chart type and builds the chart in a real charting tool while you watch. This post explains what that looks like in 2026, which jobs AI does well, where it still goes wrong, and how to check a chart an AI made before you publish it. Both charts below were built that way.
How do AI and data visualization work together?
AI helps at three points in making a chart: preparing the data, choosing and configuring the chart, and explaining what it shows. A person still decides what question the chart answers and checks that the numbers are right. The most useful setup today connects an AI assistant directly to a charting tool, so it edits real charts instead of describing them.
That last point is the big change since this topic first came up. A few years ago "AI for charts" meant asking a chatbot for advice or for plotting code you then had to run. Now an assistant can call a charting tool's functions itself through the Model Context Protocol (MCP), an open standard for connecting AI assistants to outside tools and data.
What AI is good at in a charting workflow
| Task | What the AI does | What you still check |
|---|---|---|
| Cleaning data | Fixes headers, strips currency symbols, reshapes wide tables to long | That no rows were dropped or merged |
| Choosing a chart | Matches the data shape to a chart type | That the chart answers your question |
| Configuring | Sets bindings, colours, axis ranges, number formats | Every label and the axis baseline |
| Writing text | Drafts titles, subtitles and alt text | That the title states something true |
| Iterating | Applies "make 2025 the strong colour" in seconds | The rendered result, not the settings |
The pattern in the table matters: AI is fast at the mechanical steps and unreliable at judgement. It will happily bind a value column to the labels slot or start an axis at zero when the data sits far above it. You catch both by looking at the render.
A chart built by an AI agent, step by step
The dumbbell chart below compares the share of electricity from wind and solar in 2015 and 2025. An AI agent built it in a PlotSet account through the PlotSet MCP server: it created the chart from a template, uploaded the data, set the bindings, coloured the two years, fixed the axis at 0 to 50% and added the source line.
Two things in that build show where the human checks come in. The data is from Ember's yearly electricity data, via Our World in Data, and the agent checked the source metadata before writing the footer. And the template reads data in long format, one row per country and year, which the agent had to reshape first. The step-by-step version is in our guide on how to create a dumbbell chart.
Where AI-made charts still go wrong
- Wrong bindings. A chart can render with a column in the wrong slot and still look plausible. Check that the axis labels match the column you meant.
- Invented numbers. If you ask a model to "add 2025 data" without giving it the data, it may produce numbers. Give it the file or a source, never ask it to remember statistics.
- Misleading axes. Truncated or zero-based axes change the story. Our post on data visualization dos and don'ts covers when each is honest.
- Colours that fail some readers. Ask for a colourblind-safe palette and check it, as described in our guide to colorblind-friendly palettes.
- Confident captions. A generated title can claim more than the data shows. Read it against the chart.
Visual analytics and augmented analytics, briefly
Two older terms describe the same idea from the analyst's side. Visual analytics, a field defined in the mid-2000s, pairs interactive charts with automated analysis so a person can explore data and reason about it. Augmented analytics adds machine learning and natural language to that loop, so software can suggest patterns and answer questions in plain words. An AI agent driving a charting tool is the current form of both: the software does the setup, and the person steers and judges.
AI can also make charts more interactive for readers, not just faster to build. The chart below asks you to draw how CO2 at Mauna Loa rose after 2000 before it shows the real line, using NOAA's annual means. The same agent built it, including the scoring thresholds.
How to use AI with PlotSet
PlotSet's MCP server lets an AI assistant create, edit, export and embed charts in your account. It has 18 tools: 13 for charts (list templates, read a template's settings, create a chart, upload data, set bindings and config, export, embed and more) and 5 for animated video charts.
- Add the server URL
https://mcp.plotset.com/mcpto your assistant as a custom connector. The MCP setup page has the steps for each client, and the Claude integration page covers Claude in detail. - Sign in to PlotSet when the assistant first calls a tool. It is a standard OAuth flow, so there is no API key to paste.
- Paste a table or attach a CSV and describe the chart you want. Each change comes back as a rendered image.
- Open the chart in the PlotSet editor to finish by hand, or ask for the embed link.
For prompt wording that gets better results, see our guide to ChatGPT prompts for data visualization.
FAQ
Can AI create charts from my data?
Yes. An AI assistant connected to a charting tool through MCP can upload your data, pick a template and configure the chart. You should still check the bindings, axis and labels in the rendered result.
Is AI-generated data visualization accurate?
The chart is as accurate as the data and the checks behind it. AI is reliable at mechanical setup and unreliable at facts it has to recall, so always supply the data yourself and verify the result.
What is MCP in data visualization?
The Model Context Protocol is an open standard that lets AI assistants call outside tools. A charting tool with an MCP server, such as PlotSet, lets an assistant build and edit real charts instead of only describing them.
Will AI replace data visualization designers?
It replaces repetitive setup, not judgement. Deciding what question a chart answers, which comparison is fair and what the title should claim still needs a person who knows the subject.
Which chart types can an AI build in PlotSet?
Any of PlotSet's templates, from bar and line charts to maps, dumbbell charts and interactive draw the line charts. The assistant can list the templates and read each one's settings before configuring it.