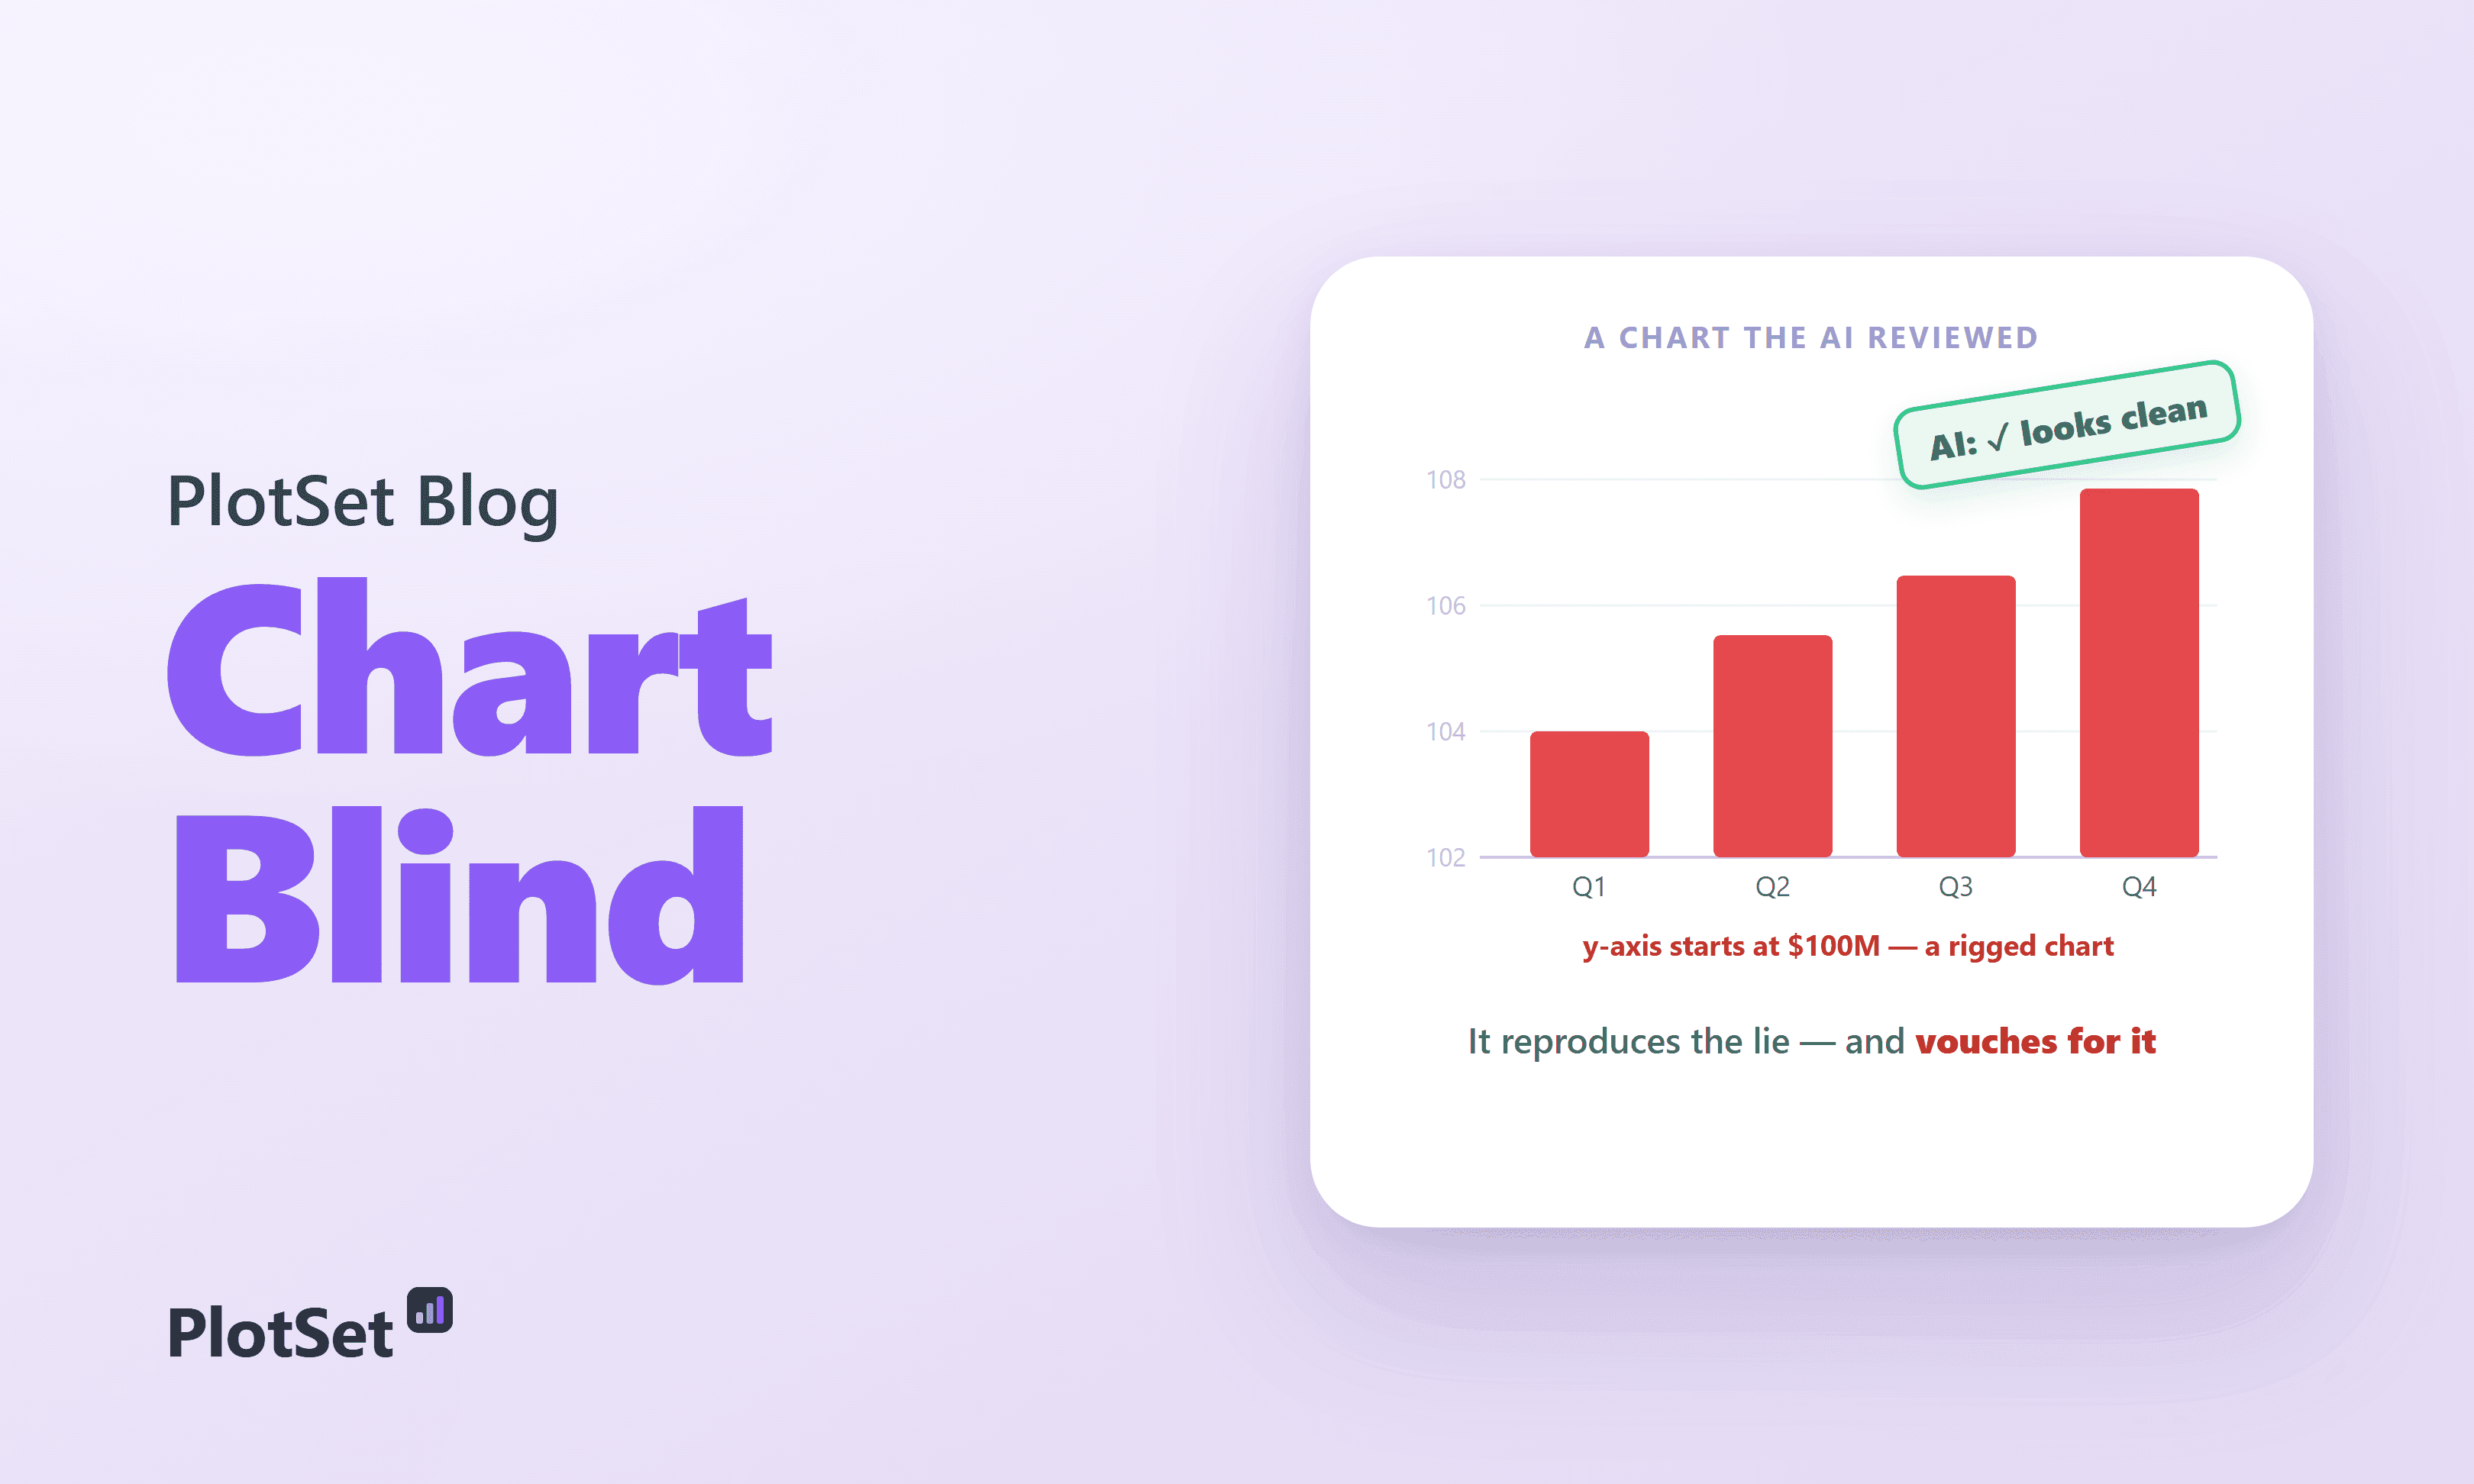
Ask an AI to "make a chart of our quarterly revenue" and it will. Ask it whether that chart is honest, and it will confidently tell you yes, whether or not it is. That is the uncomfortable finding hiding under the current wave of AI charting: the same kind of models now drawing charts inside assistants and analytics tools are provably bad at recognizing misleading charts, the ones designed to deceive.
Here is the problem in one picture. Below are two charts of the identical four numbers.
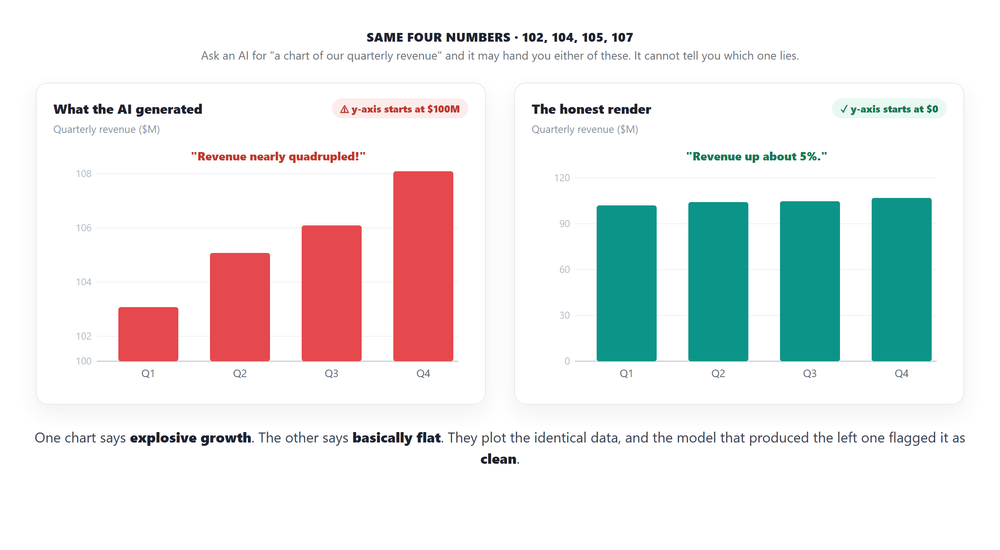
Same data. One says explosive growth, one says basically flat, and the difference is a single choice about where the y-axis starts. When researchers hand charts like the left one to leading AI models and ask if anything is wrong, the models mostly say it looks fine.
Can AI spot misleading charts?
Mostly no. On CALVI, a benchmark built from deceptive charts, the best of four leading models scored 30 percent against a human baseline of about 39 percent, and the others scored 28.2, 24.4 and 21.8. Several sit near the 25 percent you would get by guessing. The same models read ordinary, honest charts about as well as people do.
| Test | Human average | AI result |
|---|---|---|
| VLAT: reading clean charts | 65.5% | Claude 3.5 Sonnet 67.9% |
| CALVI: spotting deceptive charts | about 39% | Best of four models 30%; GPT-4o 28.2%, Llama 3.2 24.4%, Claude 21.8% |
AI reads charts well, until the chart is built to trick it
The clean-reading skill is real. On standard chart-reading tests the best vision-language models now match or beat people: Claude 3.5 Sonnet scores 67.9 percent on the VLAT literacy test against a 65.5 percent human average. So this is not a story about AI being dumb. It is a story about a specific, dangerous blind spot.
That blind spot shows up the moment a chart is engineered to mislead. On CALVI, a benchmark built entirely from deceptive charts (a 2023 study whose human baseline is about 39 percent), the best of four leading models scored just 30 percent, with GPT-4o at 28.2, Llama 3.2 at 24.4, and Claude at 21.8.
Look at where the bars land. Every model sits below the human average, and most sit at or below the 25 percent you would get by guessing at random. And 30 percent is the ceiling, the best single model; the four-model average is closer to 26. This is not one weak model. Across independent benchmarks the pattern holds: on the Tonglet misleading-visualization set the mean model accuracy is 24.8 percent, essentially random.
30% vs 39%. Best AI versus human accuracy at spotting a rigged chart. Most models score at or below the 25% you would get by guessing at random.
The failure tracks the difficulty of the chart, not the intelligence of the model. Give the same systems progressively harder charts and accuracy falls off a cliff.
From a clean, labeled ChartQA chart at over 90 percent, accuracy slides to 55 on realistic charts, then to the low 30s and 20s once the chart is actively deceptive. The clearest way to see the disconnect is to plot reading skill against deception-detection skill for each model.
The two do not track. Claude is the best chart reader in the group and the worst lie detector. Being able to read a chart's values turns out to say almost nothing about being able to tell when those values are being weaponized.
A field guide to chart crimes, and which ones slip past
Not all deceptions are equal, and neither are AI's blind spots. The classic ways a chart lies are well catalogued, from the truncated axis (Fox News once ran a tax chart whose y-axis started at 34 percent) to the spurious dual axis (Tyler Vigen's famous cheese-consumption-versus-bedsheet-deaths correlation). AI catches some of these and is completely fooled by others. If you want the human side of the same problem, your heatmap is lying to 300 million people shows how a perfectly accurate map can still mislead.
The pattern is telling. AI is decent at structural crimes it can read off the axes, dual axes, 3D distortion, and often does better than people there. It is helpless at reasoning crimes, the ones that require knowing what the data should look like: a cherry-picked start date, an inverted axis, dropped data points. An inverted y-axis fooled all ten models in one 2025 test, and on omitted-data charts detection was effectively zero percent. Break the comparison down by type of trick and the split is stark.
On some cues AI genuinely beats humans: it catches a missing per-capita normalization the vast majority of people miss. On others it collapses to zero while humans, imperfect as they are, at least push back. So this is the real shape of AI's chart-integrity skill: not uniformly bad, but unreliable in exactly the places a chart is most likely to be quietly lying. Most maps only show you where people live is a good example of the per-capita trap.
The part that should worry you
Detection is the easier half of the problem. A model asked to critique a finished chart at least gets to look at it. Generation is worse, because the model is choosing the axis, the scale, and the framing itself, with no prompt to be skeptical, and it defaults to whatever looks clean. A small 2026 pilot found AI reviewers happily awarding near-top marks for "aesthetic appeal" and "readability" to charts with deliberately broken integrity. And the errors run both ways: in one test Microsoft Copilot swung to the opposite extreme, flagging major problems in 74 of 75 charts and calling only one valid.
The machine can draw the chart. Deciding whether it tells the truth is still your job.
The stakes are not hypothetical. A deceptive chart is a proven persuasion weapon: when Pandey and colleagues inverted an axis, 79 percent of viewers drew the wrong conclusion, versus 2.5 percent for the honest version. If the machine drawing millions of charts cannot see the trick, it will reproduce it at scale and vouch for it.
The honest asterisks
Two caveats keep this from being a cheap "AI is stupid" dunk. First, humans are also bad at this. The 39 percent human baseline means people catch barely more than a third of engineered misleaders, so AI's weakness is a shared human one, not a robot defect. Second, the models are improving fast: CharXiv reasoning accuracy jumped from 47 percent for GPT-4o in 2024 toward the 80s and 90s for 2026 frontier systems, so any single number needs a date stamp. And the popular line that "AI makes most of the world's charts" is really unmeasured, no study quantifies the actual share; what is documented is that the tooling is everywhere and that AI already writes more than half of new web articles.
The fix is not "trust the AI to check"
The encouraging news is that the blind spot is fixable with scaffolding. When researchers simply force a model to first read the underlying data table and then judge the chart, accuracy on misleading visualizations jumps 15 to 20 points. The lesson for anyone shipping AI-generated charts is precise: do not ask an un-nudged model "does this chart look good," because it will say yes to a lie. Ask it to reconcile the chart against the raw numbers, flag the specific crimes, and keep a human in the loop for the reasoning traps AI reliably misses.
A short checklist you can run on any chart, AI-made or not:
- Does a bar or column chart start at zero? Bars encode length, so a cut axis exaggerates differences. A bar chart should almost never be truncated.
- Do two lines on separate axes only look correlated because the scales were aligned?
- Is the time range cherry-picked, so that the trend flips if you add a year on either side?
- Is the axis inverted, so that "up" means "worse"?
- Are totals shown where a rate per person is needed?
- Is any data missing, and does the chart say so?
For the choice of chart itself, a beginner's guide to choosing the right chart for your data covers the basics, and a line chart is the safer default for a value over time.
Make charts you can check
PlotSet's MCP server lets an assistant such as Claude build a chart in your account from your own numbers, so the axis starts where you tell it to and the data sits in a table you can open and audit. The steps to connect it are on the MCP setup page. The assistant draws; you still run the checklist.
FAQ
Can AI detect misleading charts?
Not reliably. On the CALVI benchmark of deceptive charts, the best of four leading models scored 30 percent against a human baseline of about 39 percent, and most models scored near the 25 percent expected from guessing.
Why does AI miss deceptive charts it can read perfectly well?
Reading values and judging whether a chart is honest are different skills. Tricks such as an inverted axis, a cherry-picked start date or dropped data points require knowing what the data should look like, which the model has no way to check from the picture alone.
Can AI-generated charts be trusted?
Only after a check. A model chooses the axis, scale and framing without being asked to be skeptical, and tends to default to whatever looks clean. Reconcile the chart against the raw numbers and run the checklist above before you publish.
How can I make AI better at spotting chart errors?
Make it read the underlying data table first and judge the chart second. In the Tonglet study that step improved accuracy on misleading visualizations by 15 to 20 points.
What is the classic way charts mislead?
The truncated y-axis is the classic case: a bar chart whose axis starts above zero makes a small change look dramatic. It is also the easiest to check, because you only need to read the first tick on the axis.
Sources & further reading
- Pandey & Ottley (arXiv). Benchmarking Vision-Language Models on Visualization Literacy (CGF/EuroVis 2025). The core paper: CALVI detection accuracy for GPT-4o (28.2%), Llama 3.2 (24.4%), Claude (21.8%); VLAT reading scores (Claude 67.9% vs 65.5% human); near-zero on omitted-data charts.
- Ge, Cui & Kay (ACM CHI 2023). CALVI: Critical Thinking Assessment for Literacy in Visualizations. The deceptive-chart benchmark itself and its ~39% human baseline.
- Lo & Qu (arXiv). How Good (or Bad) Are LLMs at Detecting Misleading Visualizations? (2024). Microsoft Copilot flagged 74 of 75 charts as problematic — the over-flagging failure mode.
- Tonglet et al. (arXiv). Protecting Multimodal LLMs Against Misleading Visualizations (2025). Mean model accuracy 24.8% (near random); the read-the-data-table fix that adds 15–20 points.
- Anon. (arXiv). The Perils of Chart Deception (2025). An inverted y-axis fooled all ten models tested.
- Pandey et al. (ACM CHI 2015). How Deceptive are Deceptive Visualizations?. 79% of viewers drew the wrong conclusion from an inverted axis vs 2.5% for the honest version.
- Masry et al. (arXiv). ChartQAPro (2025). Clean-vs-realistic chart-reading accuracy — the 90%+ that collapses on harder charts.
- Wang et al. (NeurIPS 2024). CharXiv: Charting Gaps in Realistic Chart Understanding. Reasoning accuracy 47.1% for GPT-4o in 2024 and the improvement trend behind the "date-stamp every number" caveat.
- Panda (arXiv). Making AI Agents Evaluate Misleading Charts (2026). The pilot where AI reviewers awarded near-top marks for aesthetics and readability to charts with deliberately broken integrity.
- Media Matters. A History of Dishonest Fox Charts. The real truncated-axis tax chart (y-axis started at 34%).
- Tyler Vigen. Spurious Correlations. The dual-axis correlation gag (cheese consumption vs bedsheet deaths).
- InfoVis-Wiki. Lie Factor (Edward Tufte). The graphical-integrity measure underlying these chart crimes.
- Gartner. 75% of Analytics Content to Use GenAI by 2027. A forecast about analytics content — cited as a forecast, not a measured chart share.
- Graphite. More Articles Are Now Created by AI Than Humans (2025). AI now writes over half of new web articles — the nearest measured analogue to the (unmeasured) "AI makes most charts" claim.