
Sample CSV
| Metric | Value |
|---|---|
| Trees planted | 1284500 |
| Volunteers | 18430 |
| Countries reached | 64 |
| Schools supported | 1207 |
A step by step walkthrough for building an animated counter in PlotSet, for one headline figure or a grid of statistics, with an embed code you can paste anywhere.
About 5 minutesYou will end up with a large number that counts up to its value when the page loads, with an optional prefix, suffix and caption.
Expect about five minutes. A single figure takes two, and a grid of statistics takes a little longer.
For a single figure no data is needed. For a grid, one row per statistic with a label and a value.
| Metric | Value |
|---|---|
| Trees planted | 1284500 |
| Volunteers | 18430 |
| Countries reached | 64 |
| Schools supported | 1207 |
The value column is read as a number.
The label column becomes the caption under each counter.
In Single mode you can type the number in the settings and leave the sheet alone.
Write numbers without thousands separators in the sheet. The ticker adds them.
The exact click path in PlotSet, from a blank template to a finished chart.
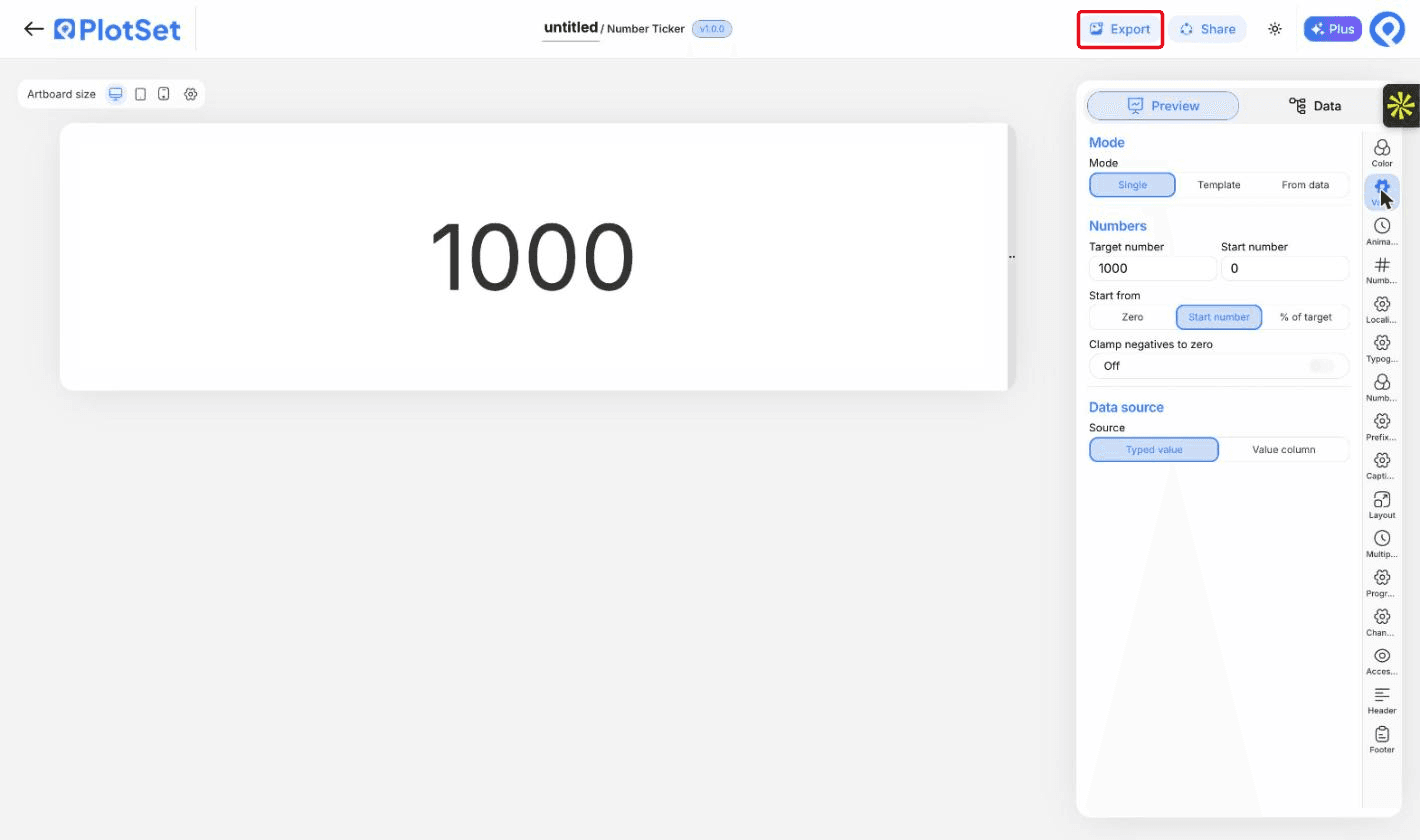
From the PlotSet dashboard, start a new project and search for Number Ticker. It opens with a single counter that counts up to 1000.

In the Value tab, choose Single for one number, Template for text with numbers inside it, or From data for a counter per row.
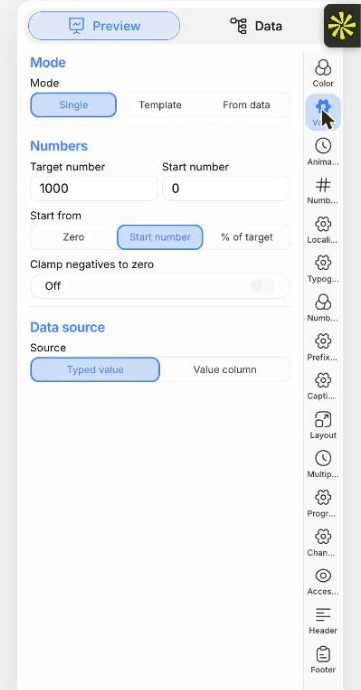
In Single mode, type the target and the start number. In From data mode, paste rows or import a CSV or .xlsx file.
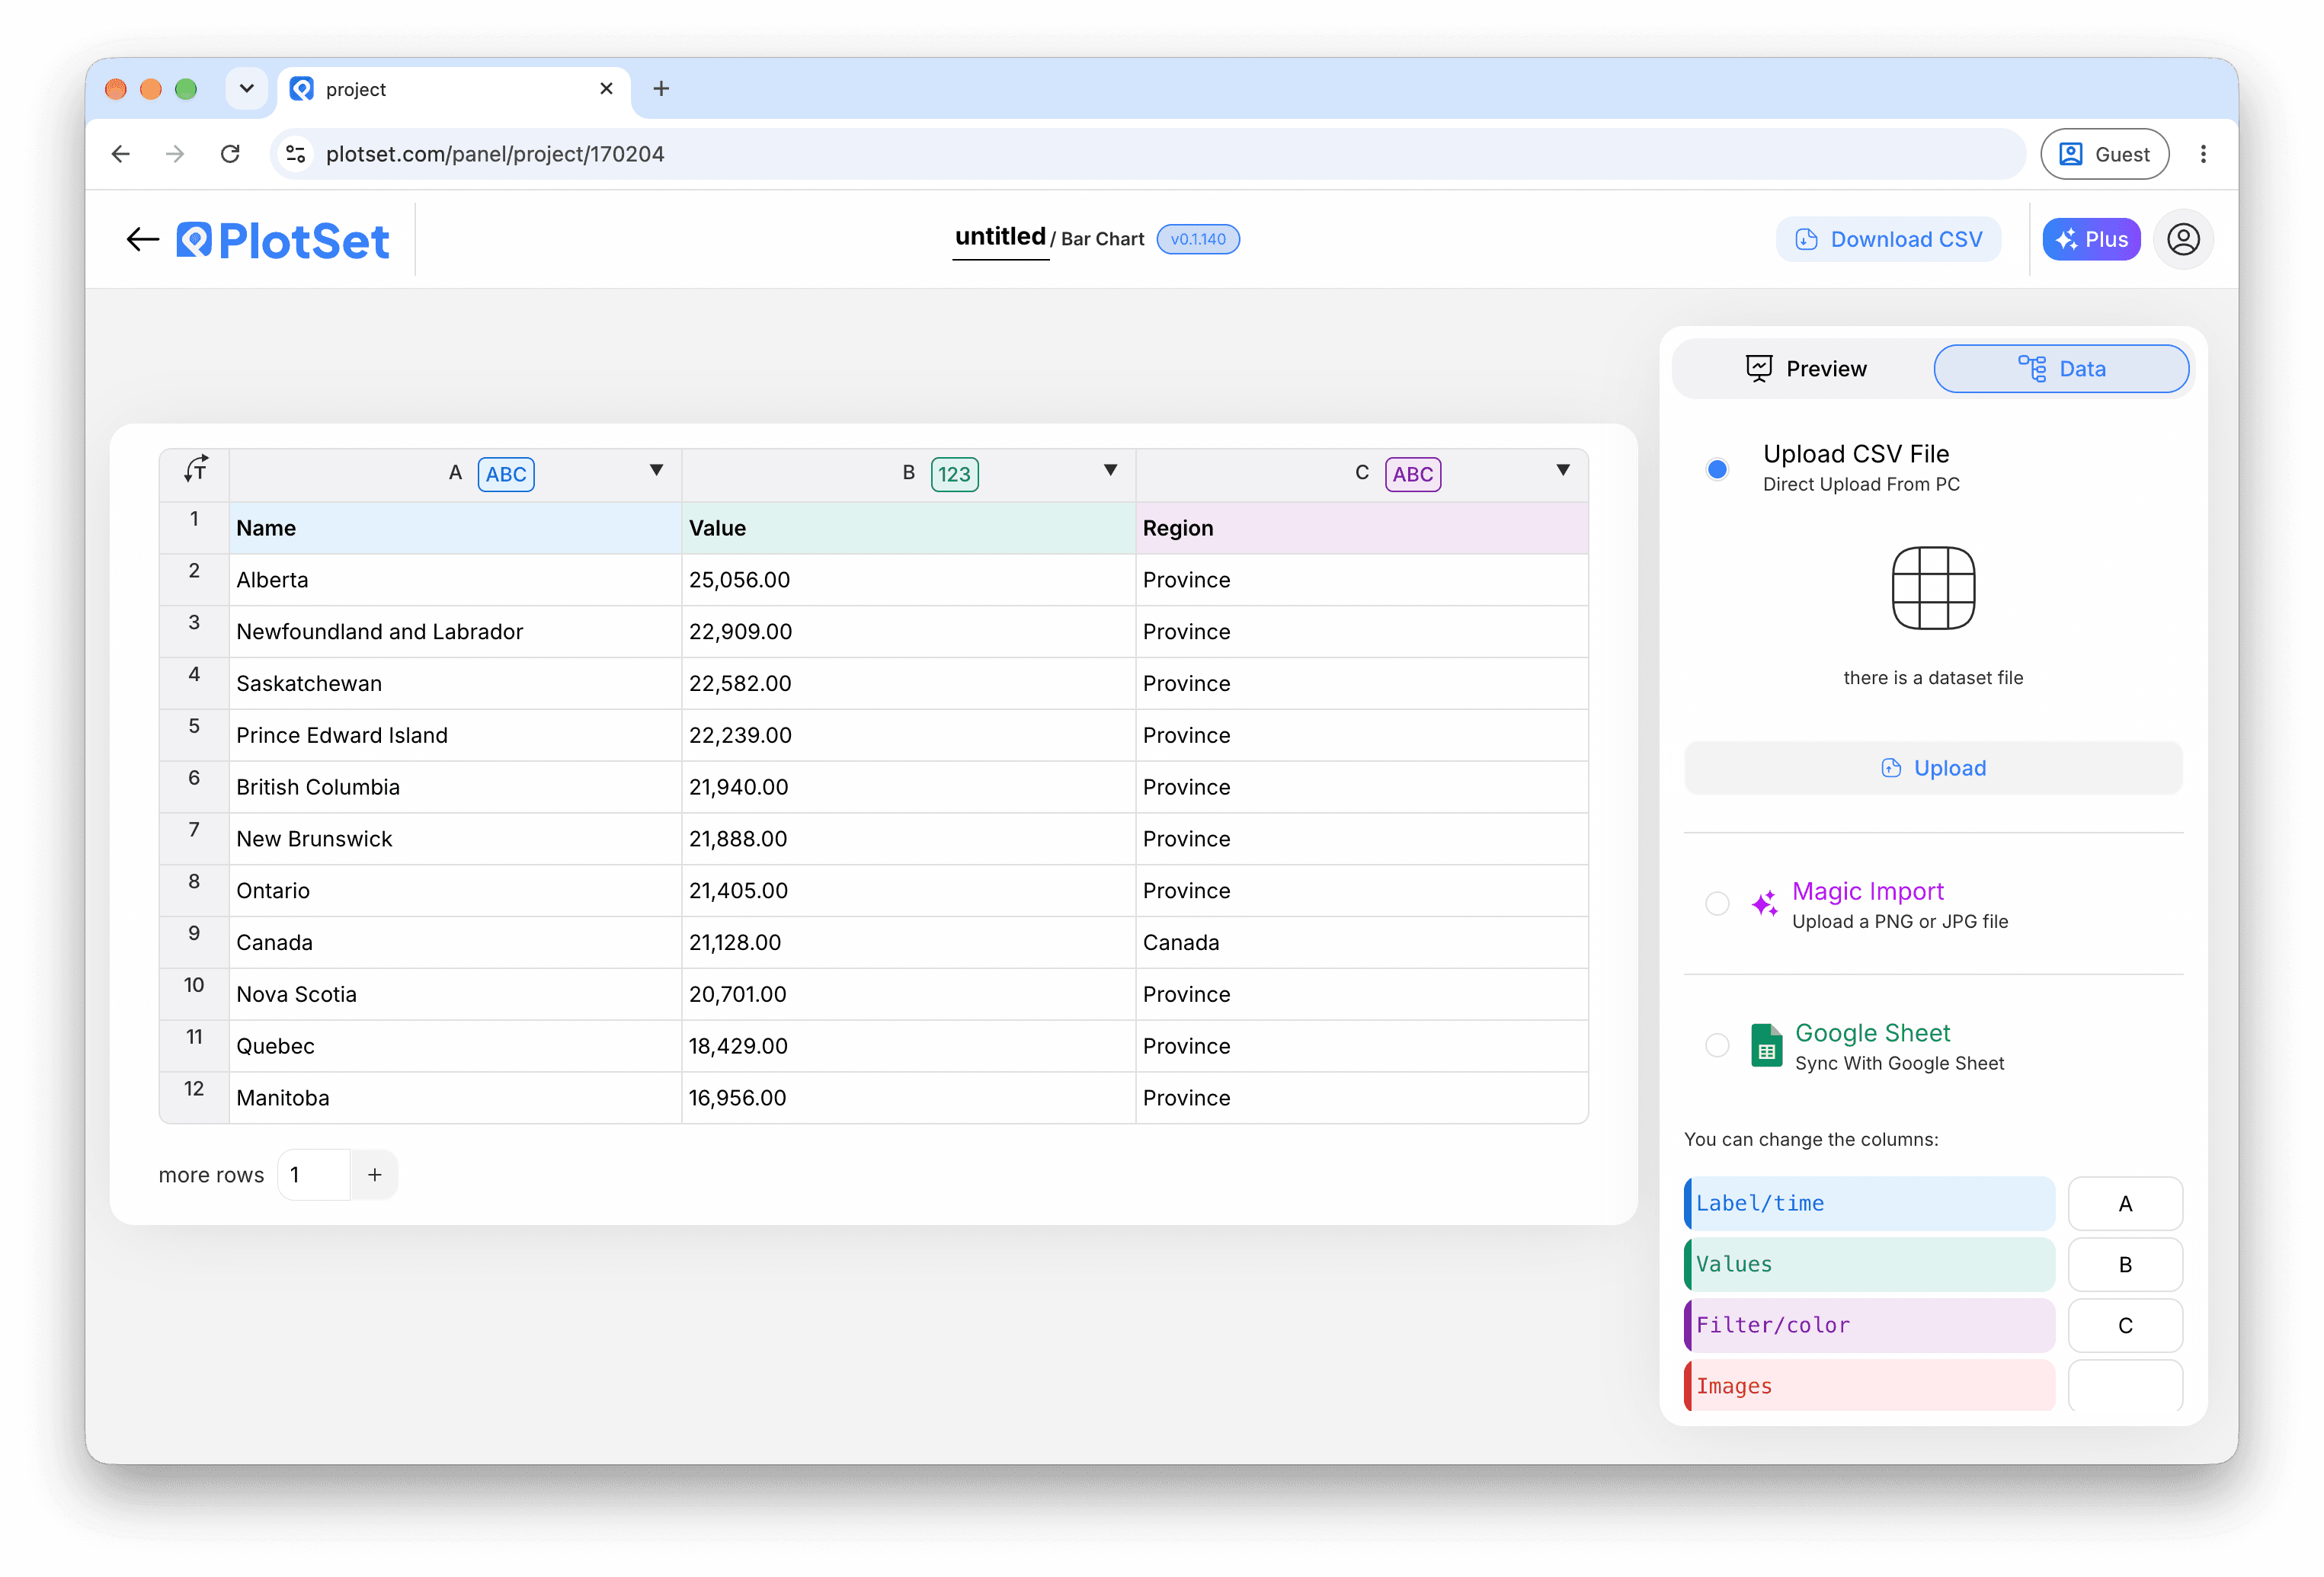
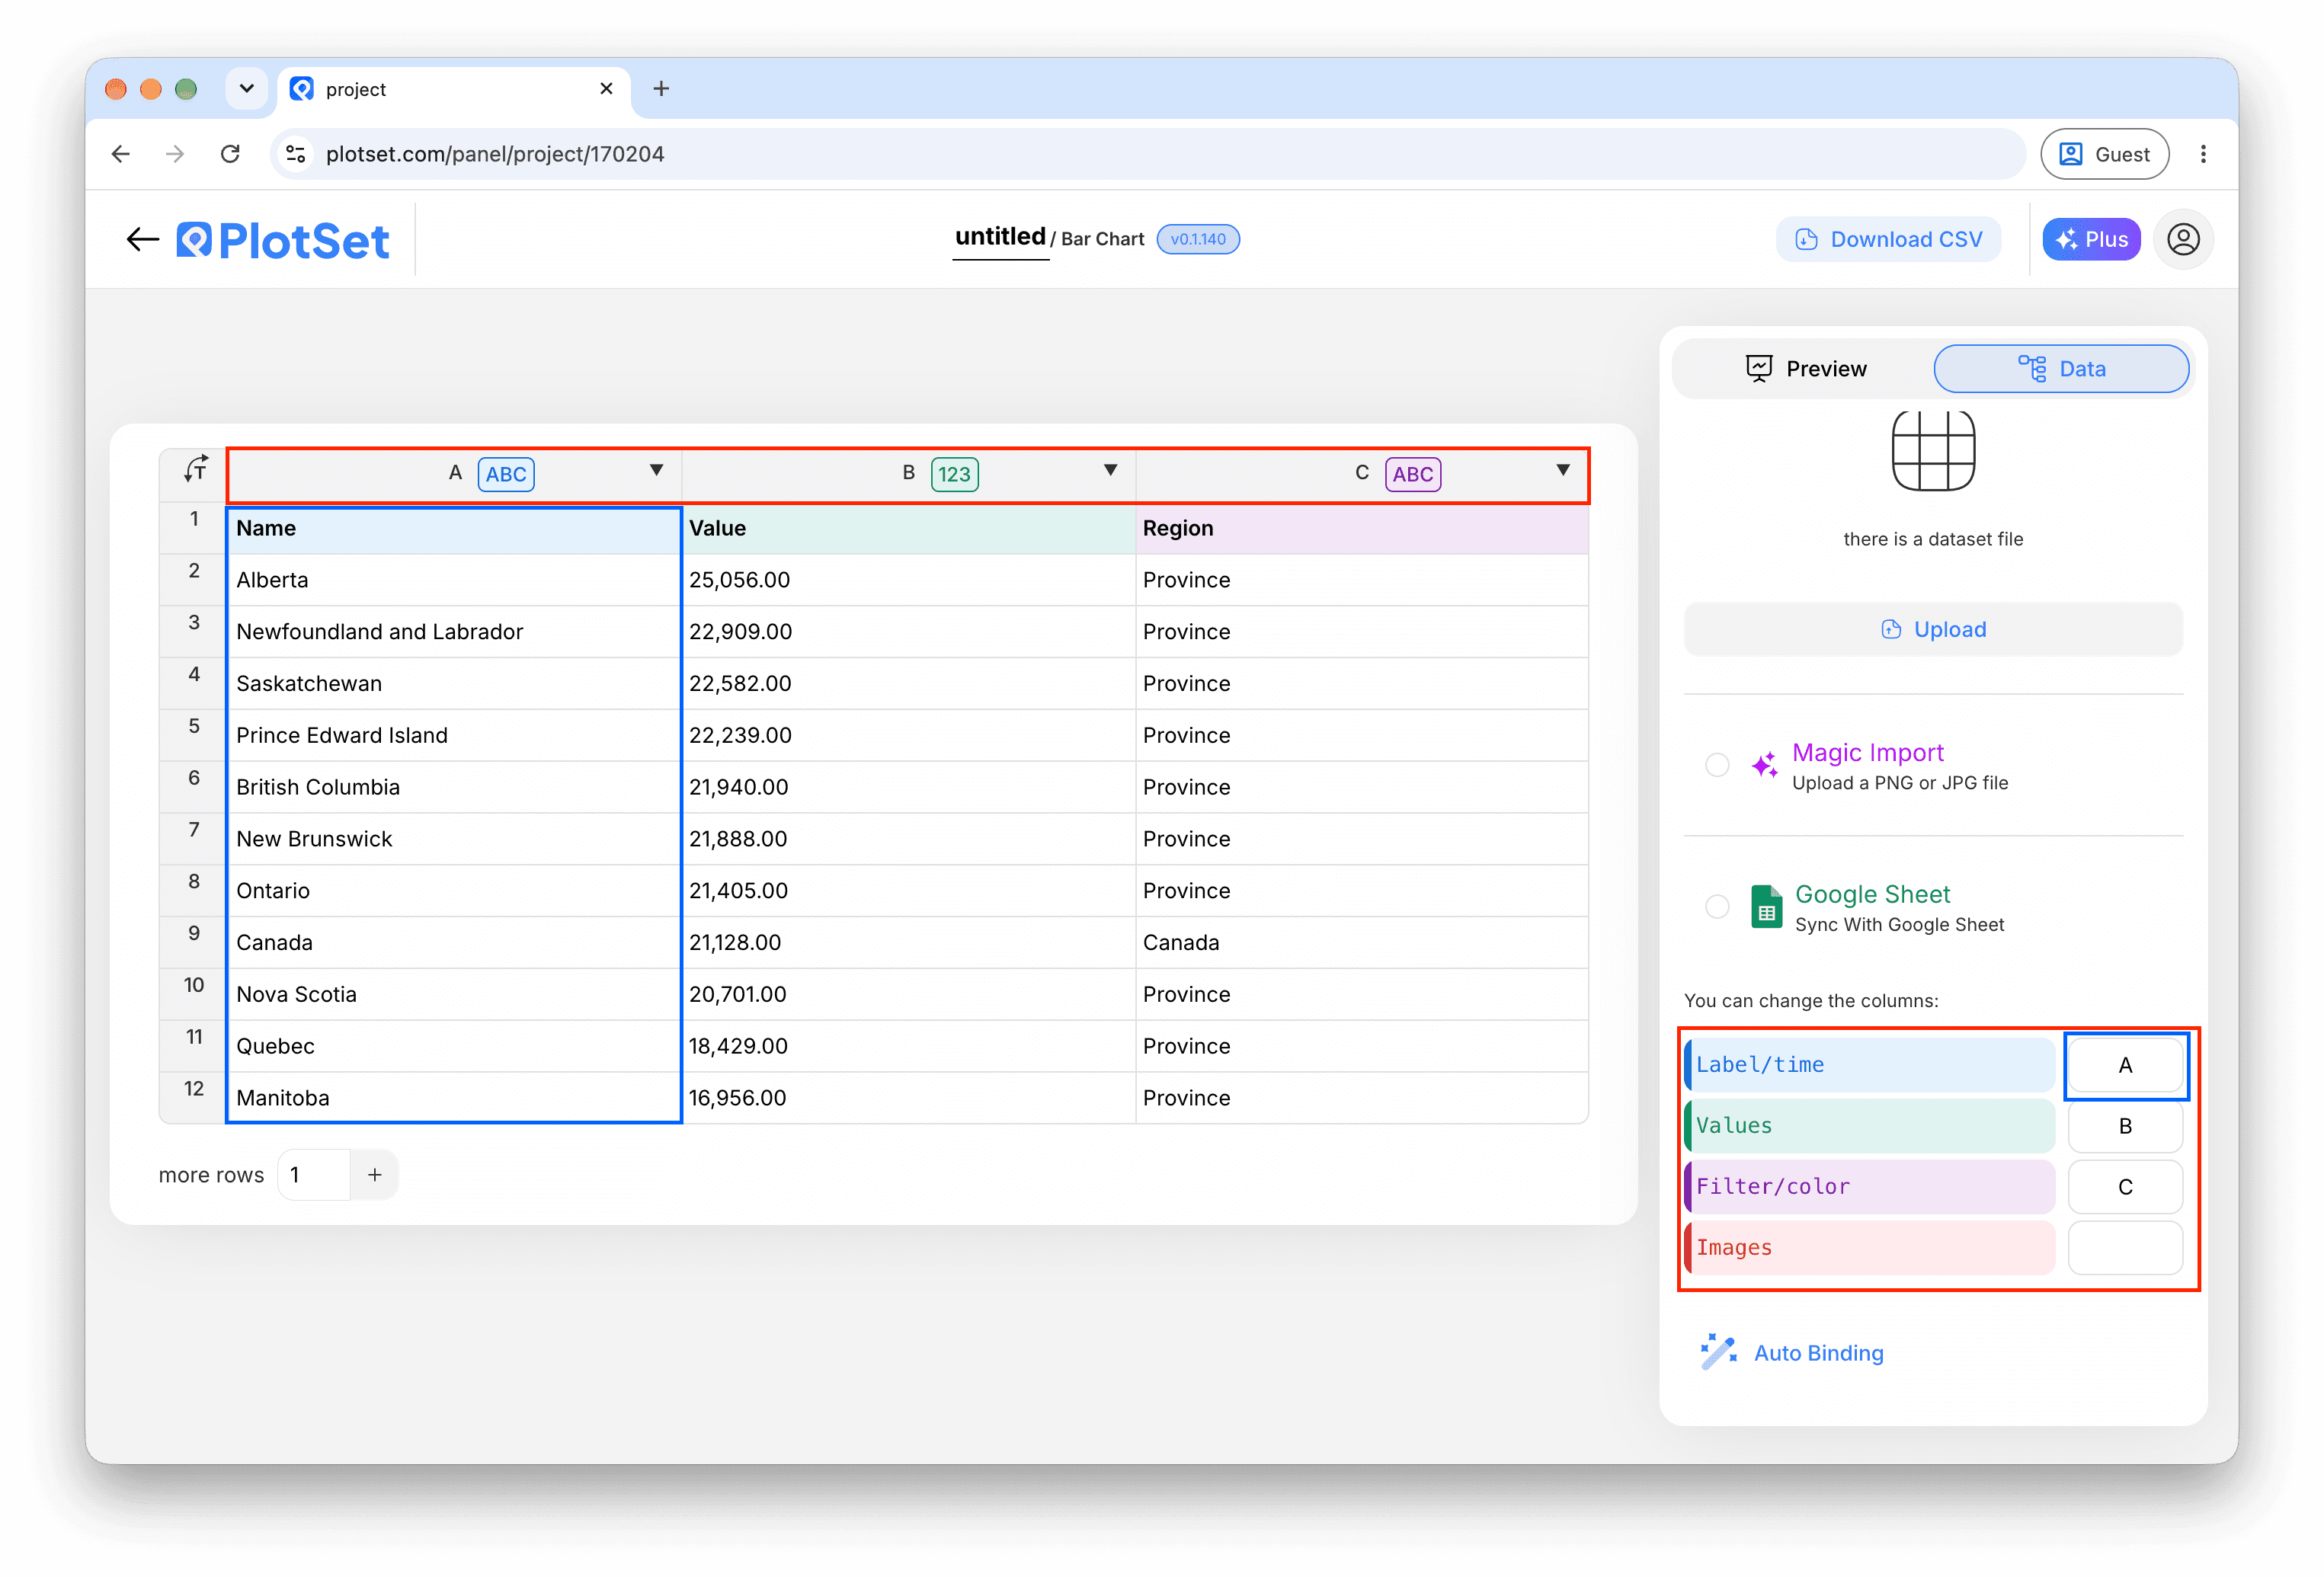
Bind the value column to Value and the label column to Label. In Single mode with a typed value, you can skip this.
In the Number format tab, add a prefix or suffix, set the decimals and choose the grouping, or abbreviate large numbers.
In the Animation tab, set the duration and easing, and choose whether the count repeats or runs once.
The Typography and Number color tabs set the font, the size and the colour, including a gradient or a colour that changes with progress.
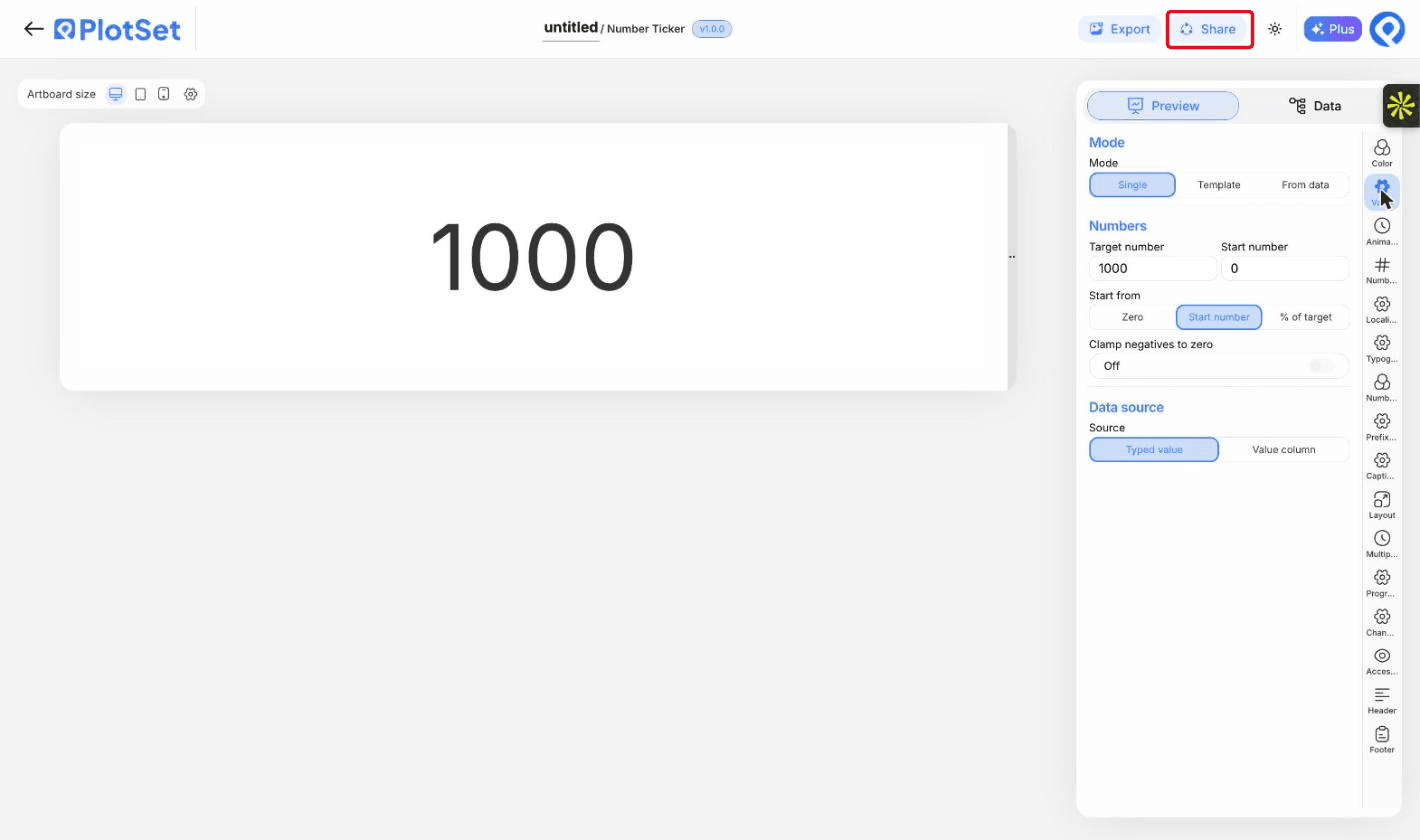
Publish for a live chart and copy the embed code from the Share dialog. Reload the page to watch the count run.
Start from the Number Ticker template with sample data already loaded, then swap in your own.
Open the templateThe last stretch is the same for every chart type: Share turns the chart into a live public link and an embed code, Export writes it out as a static file.
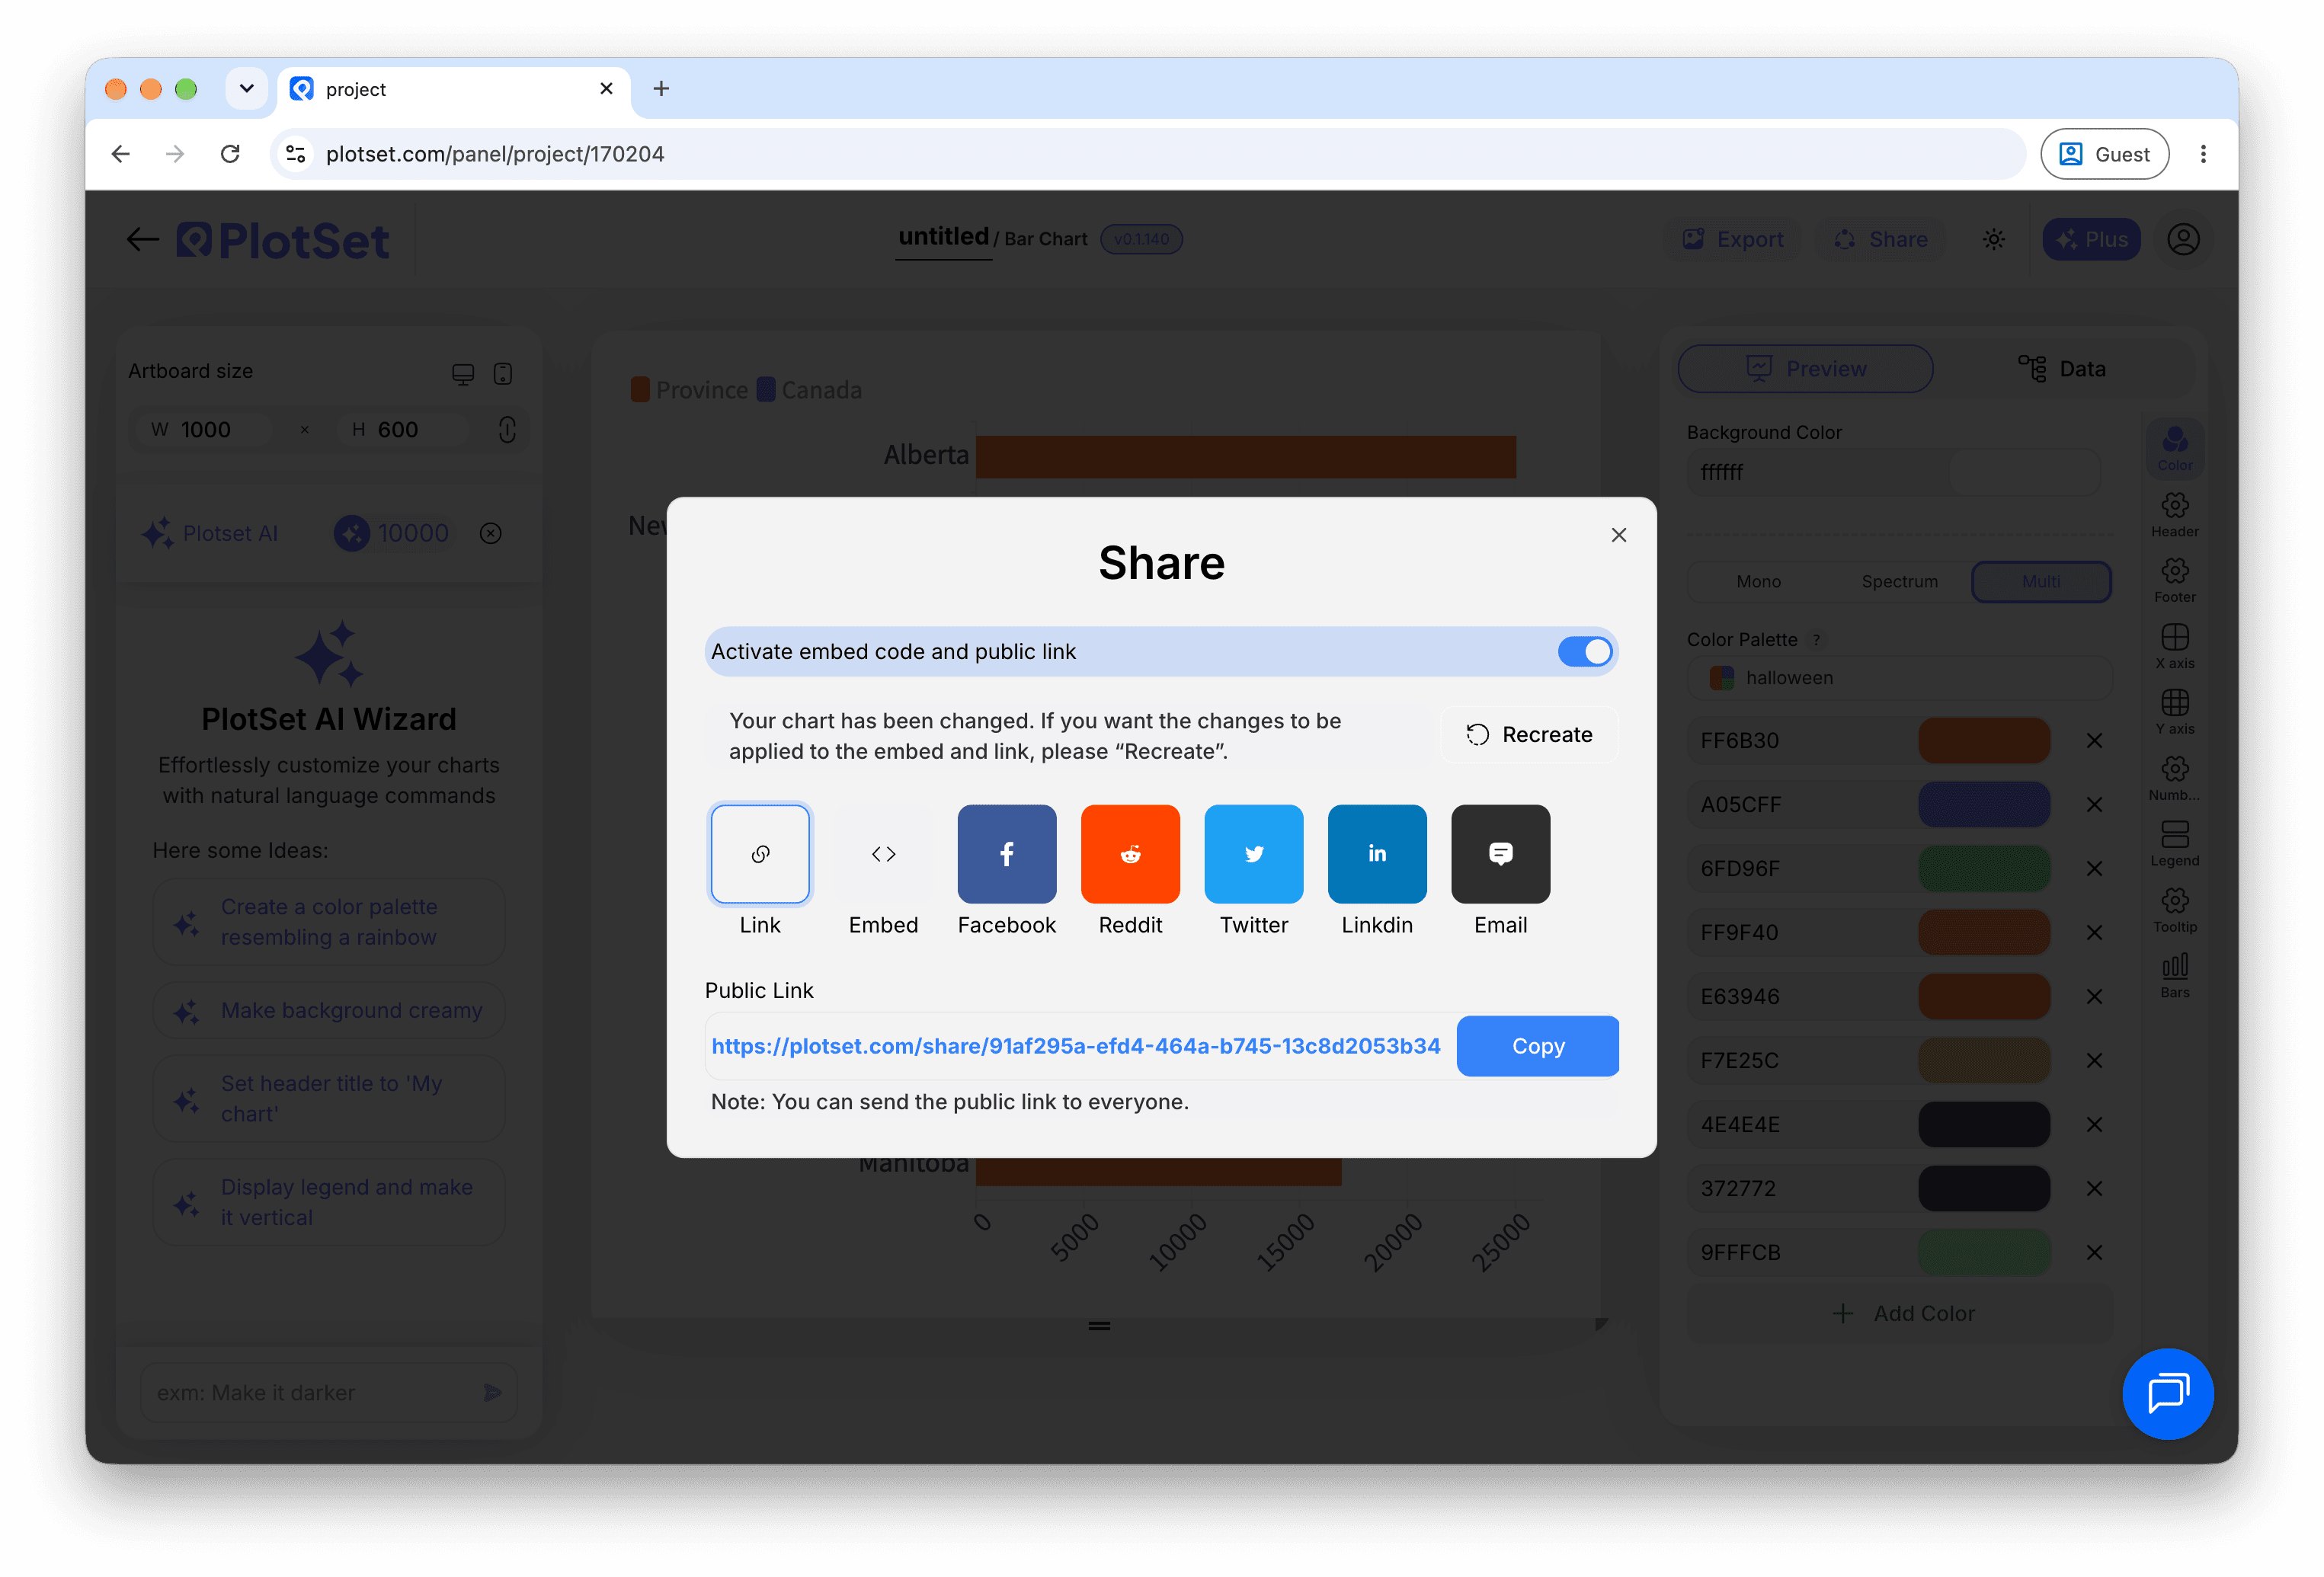
Activating the embed code and public link publishes the chart. The link is safe to send to anyone, and the embed code drops into any page as an iframe that keeps the hover tooltips and the interactivity. Edit the chart later and hit Recreate to push those changes out to both.
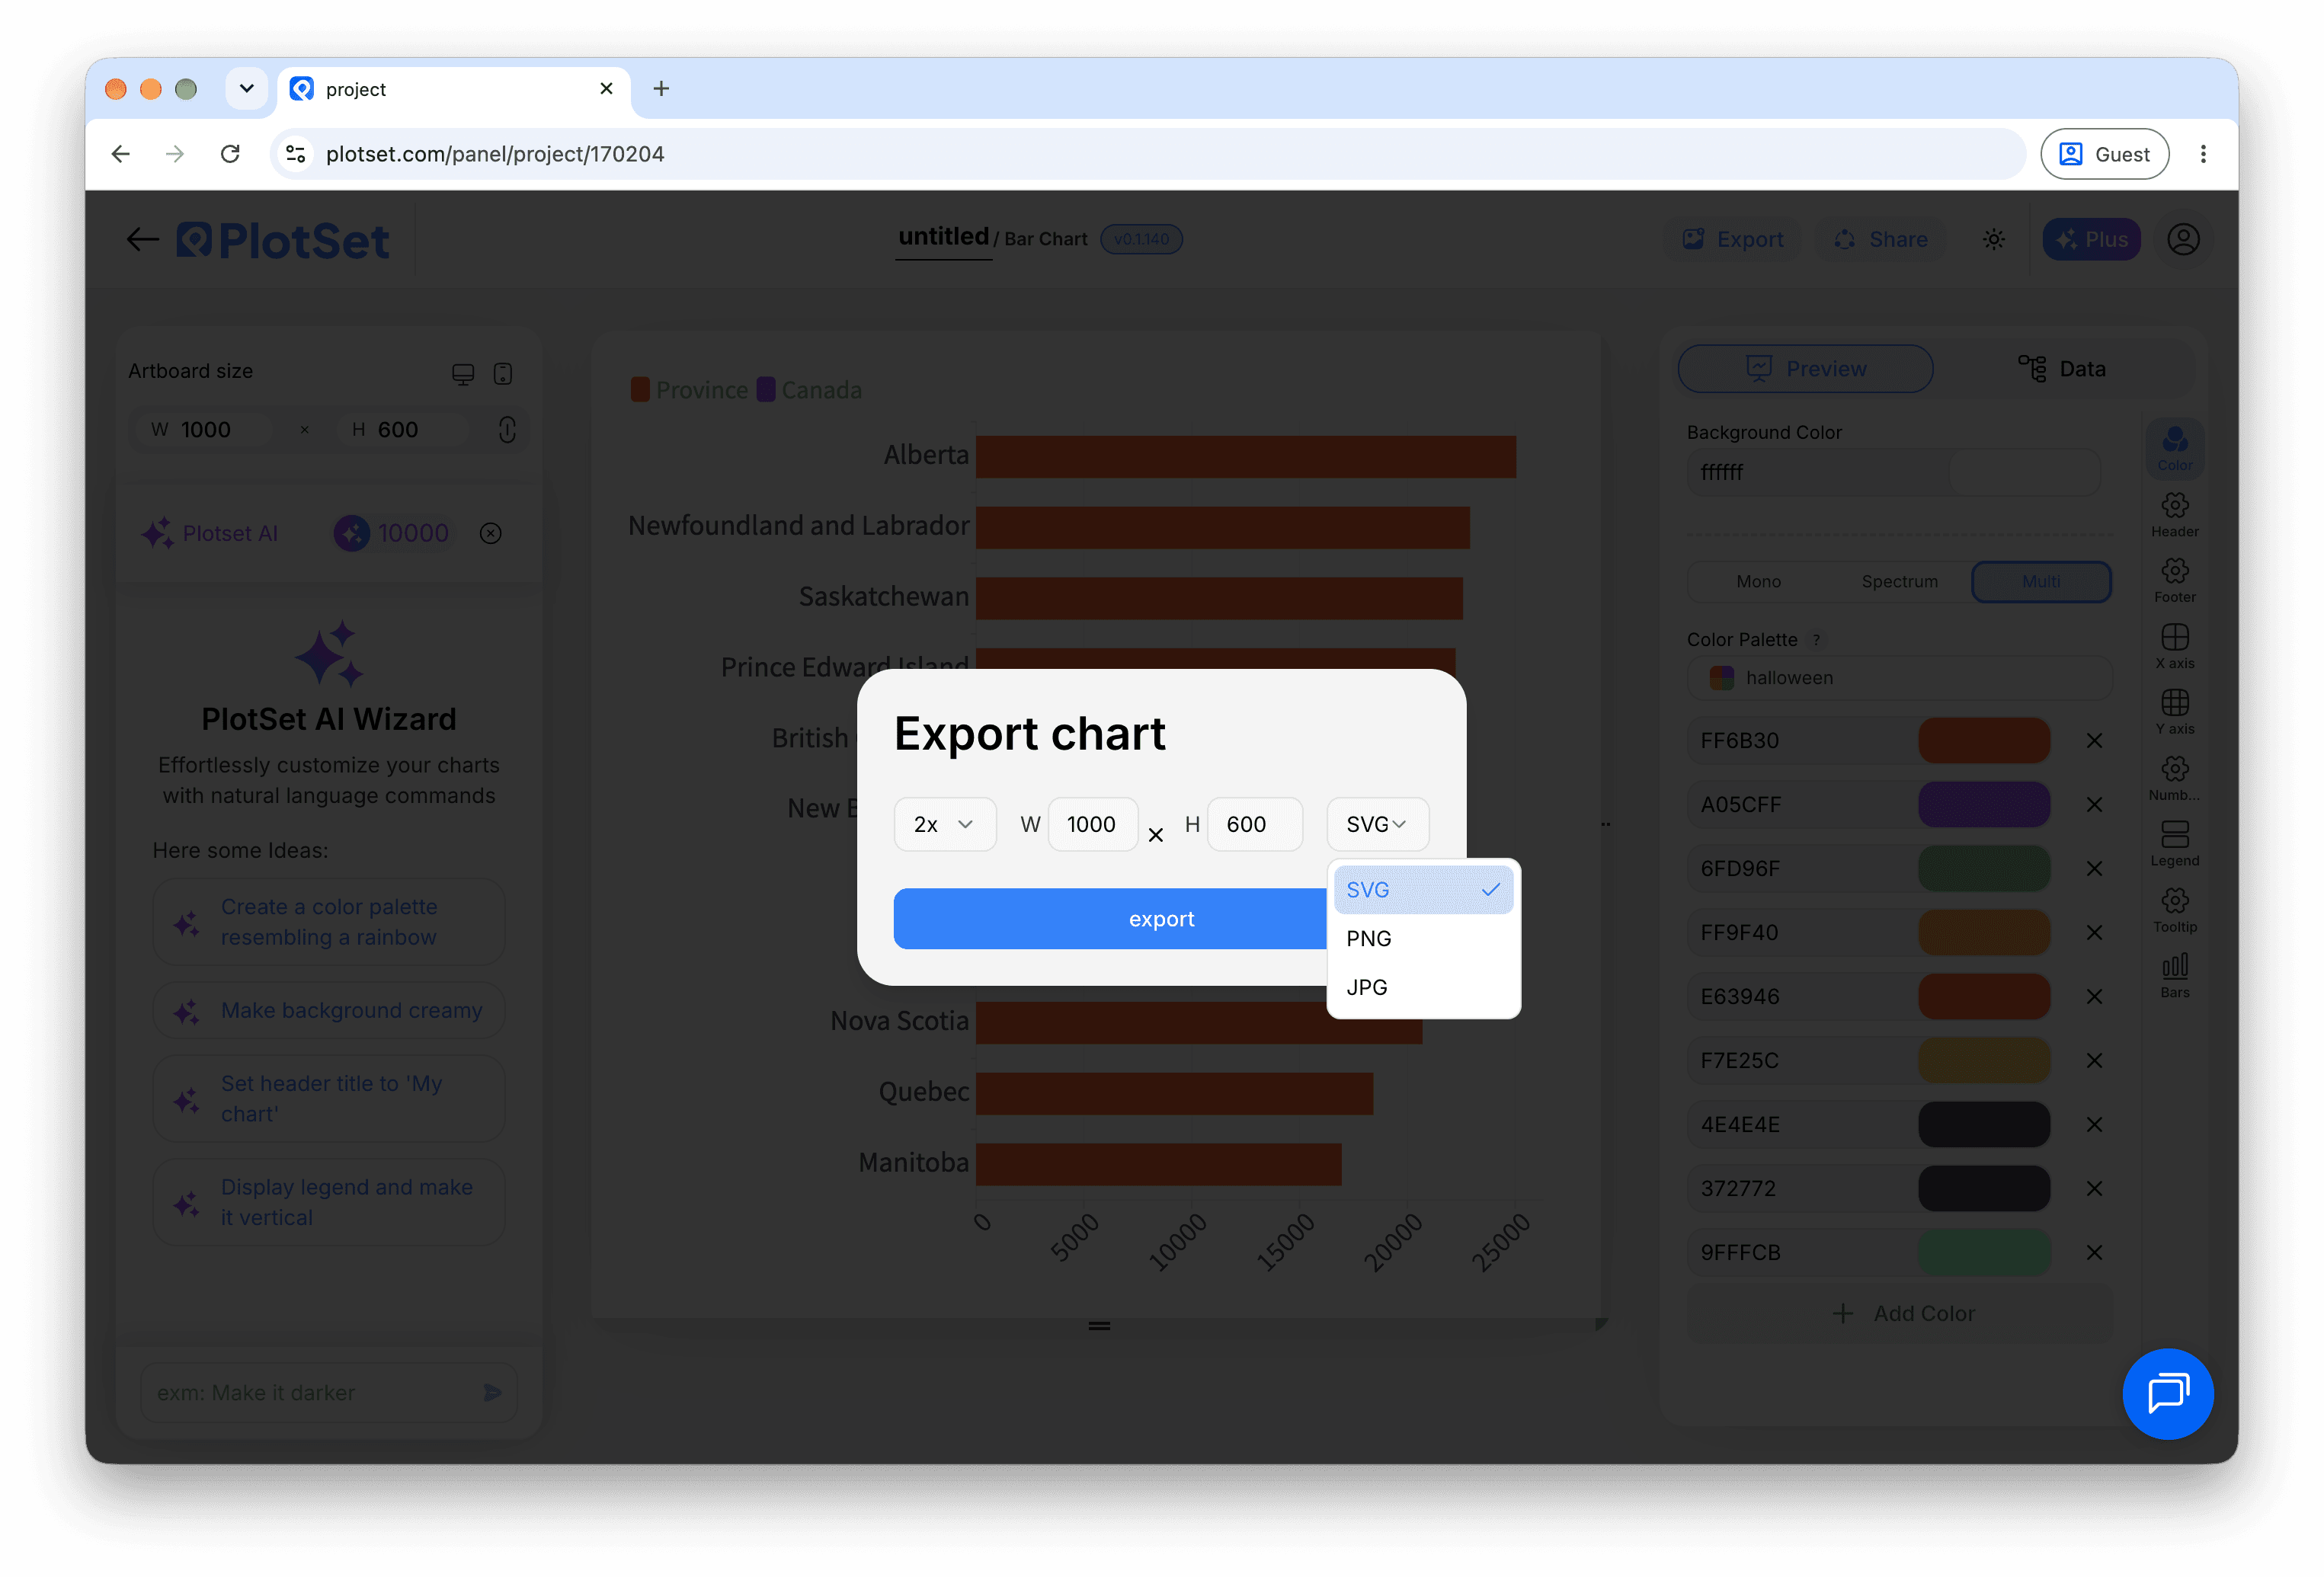
Export writes a static copy at whatever size you need. SVG stays sharp at any scale and can still be edited in a design tool; PNG and JPG are the safe choices for slides and documents. The scale multiplier is what gets you a crisp image on a retina screen.
A start number close to the target shows growth honestly. Start at zero for a figure that is new.
Two to three seconds is enough for most pages.
A short line under the number says what it counts.
1.3M reads faster than 1,284,500 in a narrow embed.
Four digit numbers print without one. Figures of 10,000 and over get it.
From data mode needs a value column. Check that it is bound and holds numbers.
It runs when the chart loads. Reload the page to see it again.
Auto-fit shrinks the figures to the smallest cell. Reduce the columns or shorten the longest value.
Not sure the Number Ticker is the right choice? See what it is, when to use it and when not to.
Yes. Set a start number higher than the target.
Free to start with 600+ templates. No credit card required.