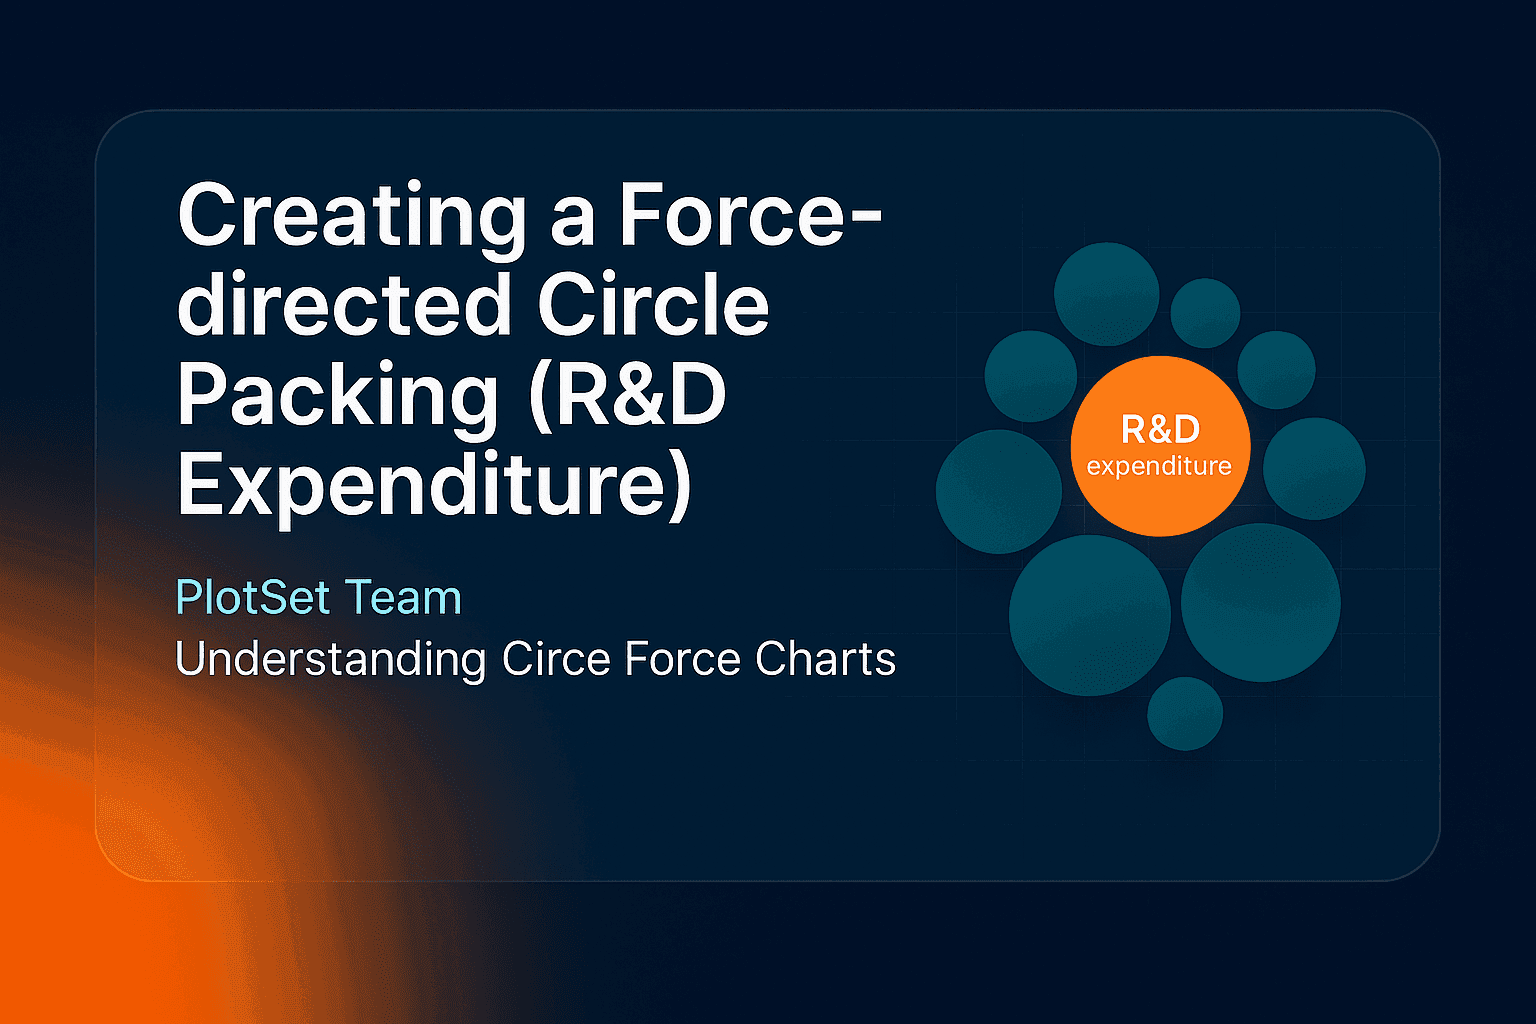
A force-directed circle packing chart draws every data point as a circle sized by its value, then lets a physics simulation push the circles into a tight cluster. It is a good pick when you have a few dozen items, one number each, and a group to colour them by. In PlotSet the template is called Circle Force.
What is a force-directed circle packing chart?
A force-directed circle packing chart is a bubble layout where circles attract and repel each other until they settle without overlapping. Size encodes the value, colour encodes the group, and position carries no meaning, so there are no axes to read. Each circle is labelled with its name and value, and hovering shows a tooltip. It sits between a bubble chart, which uses position for a second variable, and a treemap, which fills a rectangle with boxes.
The example: who spends the most on R&D?
Research and development spending as a share of GDP is a clean fit: one value per country, a natural grouping by region, and a spread wide enough to see. The World Bank publishes it as indicator GB.XPD.RSDV.GD.ZS, built on UNESCO Institute for Statistics data. The chart below shows the 28 highest-spending countries in 2023.
| Country | R&D spending, % of GDP (2023) |
|---|---|
| Israel | 6.35 |
| Liechtenstein | 6.01 |
| South Korea | 4.94 |
| Sweden | 3.60 |
| United States | 3.45 |
| Japan | 3.44 |
| China | 2.58 |
Israel's circle is the largest, with Liechtenstein close behind and South Korea third. Most of the cluster is purple, because 21 of the 28 countries are European. The United States, Japan and China sit mid-pack at roughly 2.6% to 3.5% of GDP, which tells you more about intensity than about the size of their economies. The circles show share of GDP, not dollars, so a small country can outrank a large one.
How to create a force-directed circle packing chart
- Prepare three columns. A group, a label and a number: here
Region, Country, R&D spending (% of GDP). Each row becomes one circle, and the group sets its colour. - Open the Circle Force template. Start a new project in PlotSet and search the template list for Circle Force. Sample data is already bound, so you see the layout straight away.
- Upload or paste your data. Upload a CSV (export one from Excel), paste from a spreadsheet, or connect a Google Sheet by its URL so the chart can be re-synced when the source updates.
- Check the bindings. Labels go to the country column and Values to the number. Put the region column in Filter, which is what colours the circles by group. Always confirm this after an upload, because automatic binding can pick the wrong column.
- Style it. Pick a palette, set a title and a source line, and choose a number format such as one decimal with a % suffix. White labels read best on mid-tone circles.
- Tune the force. The Force settings change how tightly circles cluster. Keep the boundary force on so the group stays inside its container, and change the seed if you want a different arrangement.
- Publish and share. You get an interactive chart with a tooltip on every circle, an embed code for any site, and PNG, SVG or JPG export.
When to use a force-directed circle packing chart
Use it when you have 10 to 60 items with one value each, when one number dominates and you want the contrast to be obvious, or when a group colour tells part of the story. It is friendlier than a treemap for a general audience, and the physics layout gives it a tidy, organic shape. If you need nested hierarchy with zoom, our circle packing tutorial covers the nested layout, and a sunburst chart shows hierarchy as rings.
Avoid it when readers must compare close values: circles of similar size look alike, and Germany at 3.15% and Finland at 3.09% are indistinguishable by eye. In that case a sorted bar chart is better. For a first look at which chart fits, see choosing the right chart for your data.
FAQ
What is the difference between force-directed circle packing and a bubble chart?
A bubble chart puts circles on x and y axes, so position means something. A force-directed circle packing chart ignores axes and lets a simulation pack the circles together, so only size and colour carry meaning. See the bubble chart how-to for the axis version.
How is circle size calculated?
Circles grow with the value, and the template scales them to fit the container, so read sizes as a rough ranking and use the printed labels for exact figures. Negative values cannot be drawn, so use a different chart if your data goes below zero.
Why do the circles move when I reload the chart?
The layout comes from a simulation that starts from a seed. The same seed gives the same arrangement every time, so set a fixed seed in the Force settings and the published chart will look the same on every load.
Can I colour the circles by group?
Yes. Bind a group column to Filter and each group gets its own colour and a legend entry. Use three to six groups at most, since more become hard to tell apart.
Where does the R&D spending data come from?
The World Bank's indicator GB.XPD.RSDV.GD.ZS, which draws on UNESCO Institute for Statistics figures for research and development expenditure as a share of GDP. The chart uses 2023 values, the latest year with broad coverage.