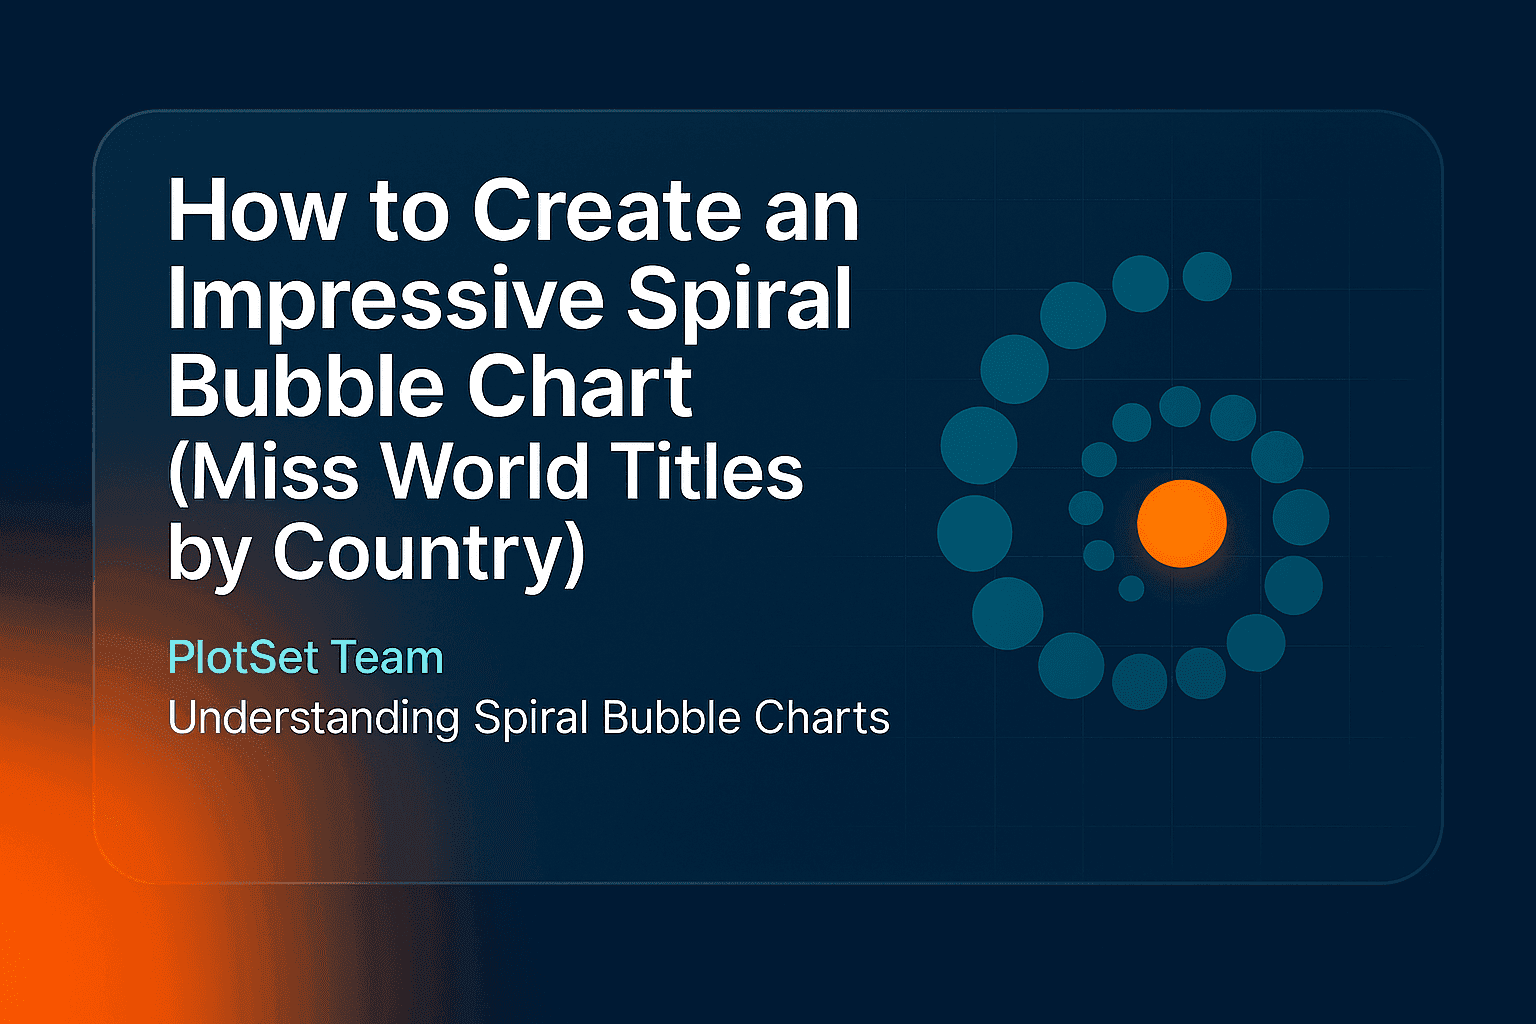
A spiral bubble chart turns a ranked list into a single shape: circles sized by value, wound along a spiral from the largest to the smallest. This guide shows how to create a spiral bubble chart in PlotSet using the Paris 2024 gold medal table, explains the three settings that control the spiral, and says when a plainer chart is the better choice.
What is a spiral bubble chart?
A spiral bubble chart places one circle per item along a spiral. Each circle's area shows its value, and the items are sorted, so the biggest sit at the outer end and the smallest at the centre. It suits short ranked lists where the visual impact matters more than exact comparison.
It is a close relative of the bubble chart. A standard bubble chart uses position to encode data. In a spiral, position only shows rank, so size and colour carry the message.
The example: gold medals at Paris 2024
The chart below shows the 15 countries with the most gold medals at the Paris 2024 Olympics, from the final medal table. Circle size shows gold medals, and colour shows the continent.
The spiral makes three things easy to see:
- Two countries stand apart. The United States and China won 40 gold medals each, twice as many as Japan in third place. Together they hold 80 of the 238 golds in this top 15.
- The middle is crowded. Seven countries, from Australia down to Germany, sit between 12 and 18 golds, so their circles look almost alike.
- Europe is spread out, not on top. Seven of the 15 countries are European, with 80 golds between them, against 81 for the four Asian countries.
| Continent | Countries in the top 15 | Gold medals |
|---|---|---|
| Asia | 4 | 81 |
| Europe | 7 | 80 |
| Americas | 2 | 49 |
| Oceania | 2 | 28 |
How to create a spiral bubble chart in PlotSet
- Prepare the data. You need a label column and a value column, and a category column is useful for colour. An image column is optional and takes one image URL per row. Row order does not matter, because the chart sorts by value.
- Open the template. Start a new project and search the template list for "Spiral Bubble". It opens with sample data on US restaurant chains, with logos in the circles.
- Add your data. Upload a CSV (export one from Excel), paste rows from a spreadsheet, or import a Google Sheet.
- Check the bindings. The sample expects Category in column A, label in B, value in C and image in D. If your sheet differs, set each one by hand and clear the image binding if you have no images.
- Shape the spiral. Open the Spiral Bubble tab and adjust the three settings described below, along with the maximum circle radius.
- Fix the labels. In the Label tab, set the minimum and maximum font sizes so the text fits both the largest and the smallest circles. The default uppercase italic style can be turned off, and the text shadow is worth removing if labels look blurred.
- Add a title and source. Say what size and colour mean in the subtitle, because a spiral has no axis to explain them.
- Publish, embed or export. Publish for an interactive chart with tooltips, copy the embed code, or export a PNG, SVG or JPG.
The three settings that shape the spiral
| Setting | What it does | Default |
|---|---|---|
| Angular gap | Sets the spacing between one circle and the next along the spiral | 0.5° |
| Quadratic coefficient | Controls how tightly the spiral packs: lower is denser, higher is wider | 0.5 |
| Initial angle | Rotates the starting point of the spiral | 450° |
Start with the quadratic coefficient, since it changes the overall shape most. The example lowers it to 0.3 so the 15 circles stay together as one coil. Use the initial angle last, to turn the largest circles to where they sit best with your title and legend.
When a spiral bubble chart is the wrong choice
- Readers need exact comparisons. Circle areas are hard to compare. A sorted bar chart shows the gap between 12 and 14 at a glance.
- The values are nearly equal. With no clear size differences, the spiral becomes a coil of look-alike circles.
- You have many items. Past about 30, the inner circles become too small to label. A treemap holds more.
- Position should mean something. If you have two measures to plot against each other, see how to create a bubble chart.
- The groups matter more than the ranking. To cluster circles by category, try force-directed circle packing.
Frequently asked questions
What is a spiral bubble chart used for?
It is used to show a short ranked list in an eye-catching way, such as medal tables, top brands or the largest companies. It works well in social posts, reports and page headers, where a memorable shape helps the data get noticed.
How many items should a spiral bubble chart have?
Between about 10 and 30. Fewer than 10 looks sparse, and many more leaves the smallest circles too small for labels.
Can I put images or logos in the circles?
Yes. Add a column of image URLs and bind it to the Image URL field. You can set the image opacity in the Spiral Bubble tab.
Do I have to sort my data first?
No. The chart sorts rows by value, so the largest items always end up at the outer end of the spiral.
Can I make a spiral bubble chart in Excel?
Not with a built-in chart type. Save your sheet as a CSV, upload it to PlotSet, and you can export the result as a PNG, SVG or JPG to paste back into your workbook.