
The idea
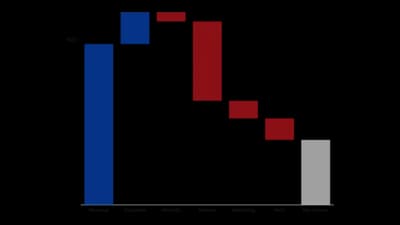
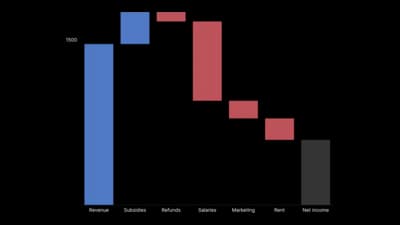
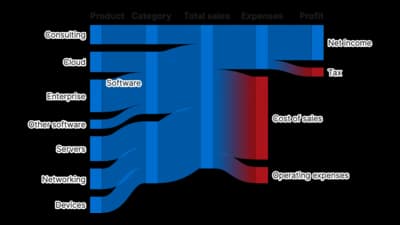
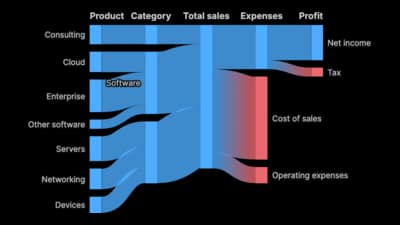
A waterfall chart steps from a starting total through the increases and decreases to an end total, so you see how each piece moved it. It is the standard way to explain a change in a profit, a headcount or a balance. An income statement version flows the same idea across a page.
Where to use it
- From revenue to profit, step by step
- Headcount changes over a year
- Budget variance by item
- Cash flow and income statements
Templates
Start from any of these templates and swap in your own data.
Ready to Transform Your Data Storytelling?
Join +6,000 creating stunning charts and video visuals with the all-in-one AI data visualization platform.
PlotSet helps data analysts, marketers, and designers transform complex data into clear, compelling stories. start creating today.