
Tile Grid Map
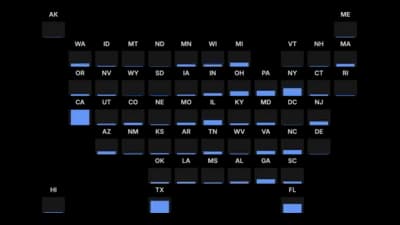
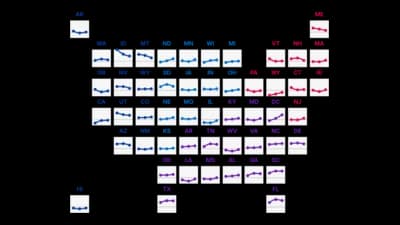
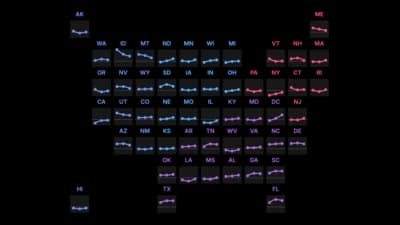
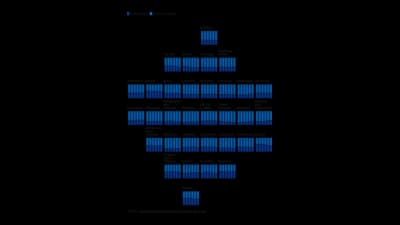
Every region as an equal tile, with a small chart inside each.



The idea
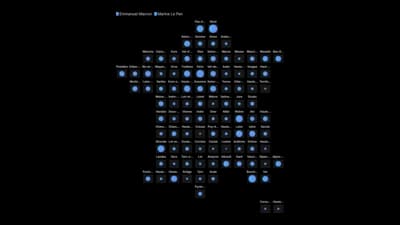
A tile grid map gives every region the same square, laid out roughly where it sits on the map, so small places are as visible as big ones. Each tile can hold a chart of its own. It trades exact geography for a fair comparison.
Where to use it
- Charts for every European country
- French departments or London boroughs
- States of equal weight regardless of area
- A small trend line in every region
Templates
Start from any of these templates and swap in your own data.


Ready to Transform Your Data Storytelling?
Join +6,000 creating stunning charts and video visuals with the all-in-one AI data visualization platform.
PlotSet helps data analysts, marketers, and designers transform complex data into clear, compelling stories. start creating today.