
The idea
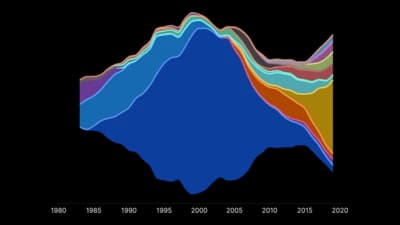
A stream graph is a stacked area chart centred on a middle line, with smooth curves, so the layers flow like a river. It suits many categories over a long time and shows rhythm more than exact values. Label the biggest streams directly.
Where to use it
- Topics rising and falling over years
- Music or media genres over time
- Many categories across a long period
- Visual overviews of change in composition
Templates
Start from any of these templates and swap in your own data.
Ready to Transform Your Data Storytelling?
Join +6,000 creating stunning charts and video visuals with the all-in-one AI data visualization platform.
PlotSet helps data analysts, marketers, and designers transform complex data into clear, compelling stories. start creating today.