
Stacked Bar Graph
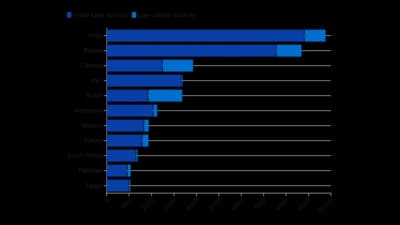
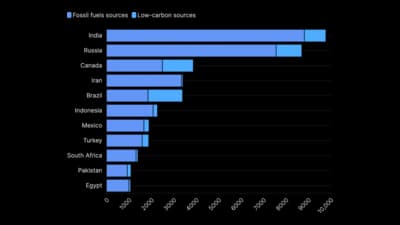
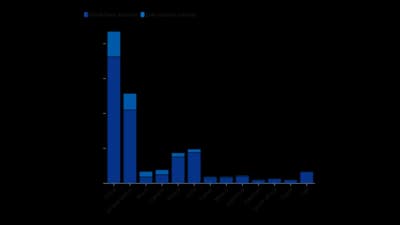
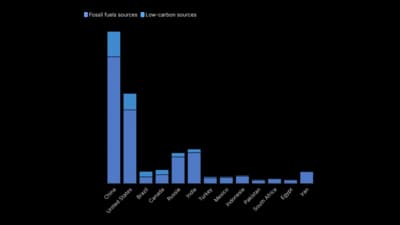
Bars split into segments that show a total and its parts.
The idea
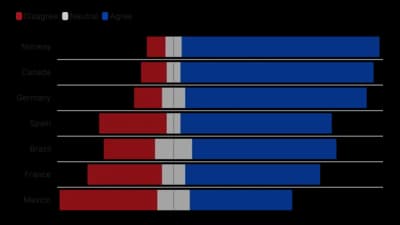
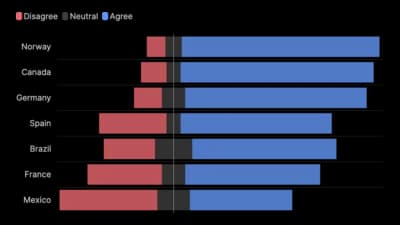
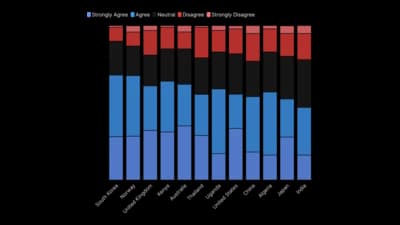
A stacked bar graph divides each bar into segments, so you see the total and what it is made of. Only the bottom segment shares a baseline, so keep the parts few and put the one you care about first. Diverging versions centre the answers on a neutral point.
Where to use it
- Totals broken into their parts
- Likert-scale and satisfaction scales
- Composition across a few periods
- Agree and disagree around a centre line
Templates
Start from any of these templates and swap in your own data.
Ready to Transform Your Data Storytelling?
Join +6,000 creating stunning charts and video visuals with the all-in-one AI data visualization platform.
PlotSet helps data analysts, marketers, and designers transform complex data into clear, compelling stories. start creating today.