
The idea
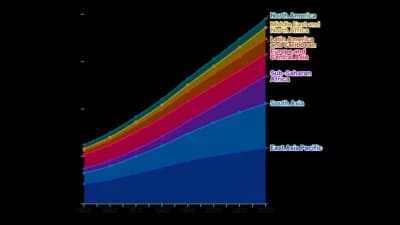
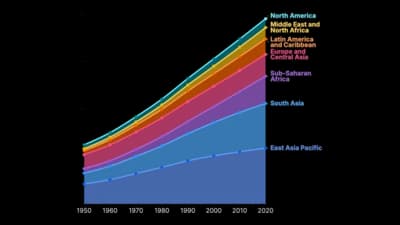
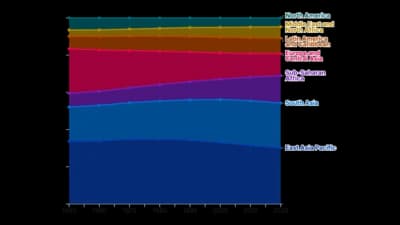
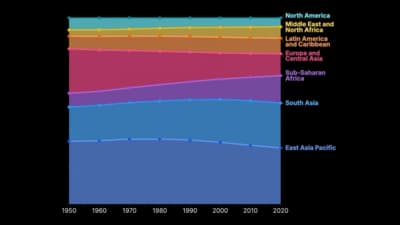
A stacked area graph piles each series on top of the one below, so you see both the overall size and how every part contributes through time. The proportional version fixes the total at 100% to show shifts in share. Limit the number of layers, since only the bottom one shares a baseline.
Where to use it
- Revenue by product line over the years
- Energy mix or budget split by period
- Market share shifts between competitors
- Audience or traffic broken down by source
Templates
Start from any of these templates and swap in your own data.
Ready to Transform Your Data Storytelling?
Join +6,000 creating stunning charts and video visuals with the all-in-one AI data visualization platform.
PlotSet helps data analysts, marketers, and designers transform complex data into clear, compelling stories. start creating today.