
Slope Chart
Lines between two points in time that show who rose and who fell.
The idea
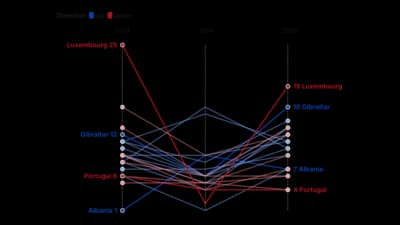
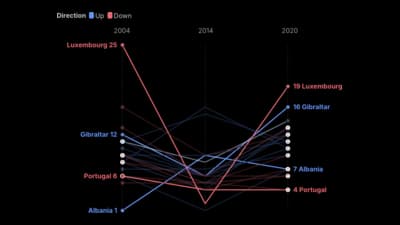
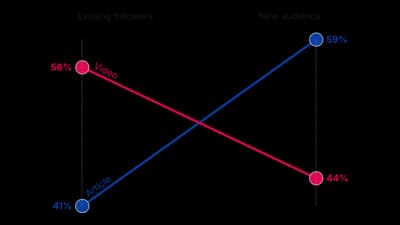
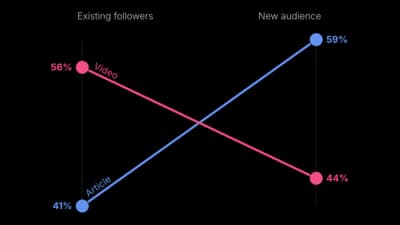
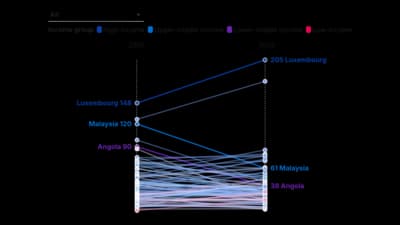
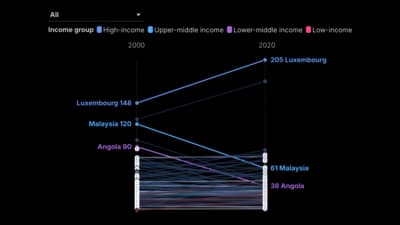
A slope chart compares each item at two moments, so the steepness of the line is the change. It is a sharp alternative to paired bars when the story is rise and fall. Label both ends and highlight the lines that matter.
Where to use it
- Rankings before and after
- Survey results across two years
- Budgets or prices at two dates
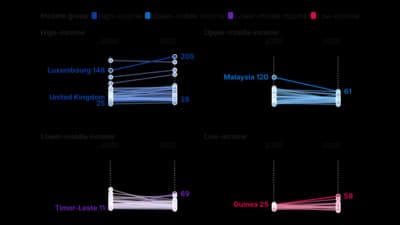
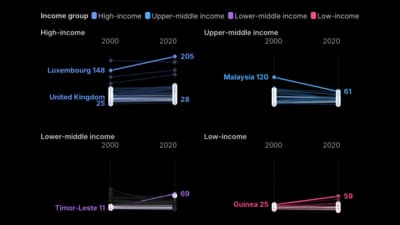
- Many slopes side by side in a grid
Templates
Start from any of these templates and swap in your own data.
Ready to Transform Your Data Storytelling?
Join +6,000 creating stunning charts and video visuals with the all-in-one AI data visualization platform.
PlotSet helps data analysts, marketers, and designers transform complex data into clear, compelling stories. start creating today.