
Sankey Diagram
Bands whose width shows how much flows from one stage to the next.
The idea
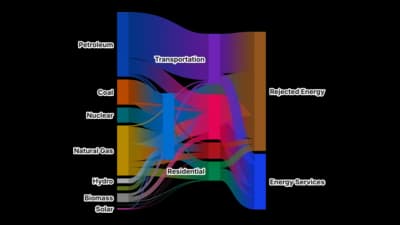
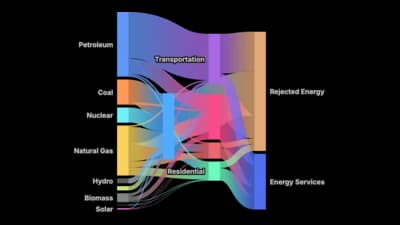
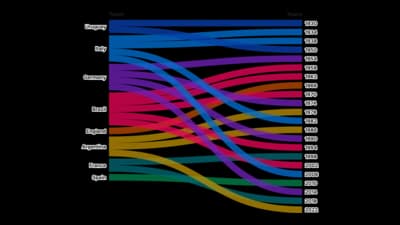
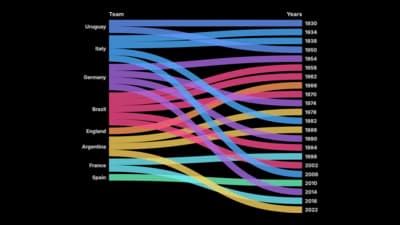
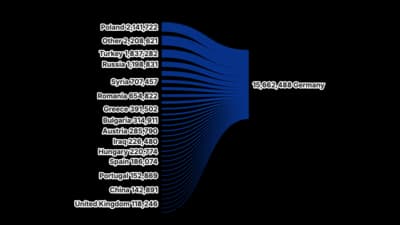
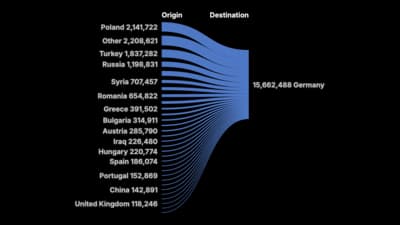
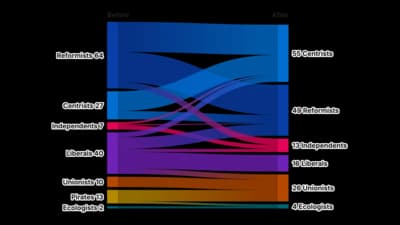
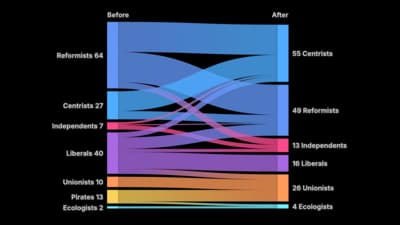
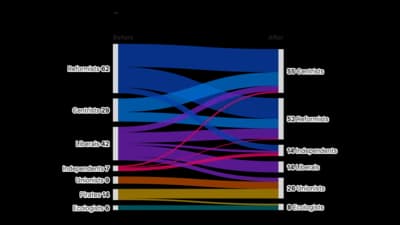
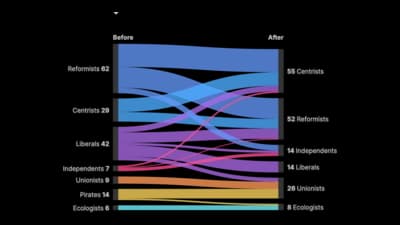
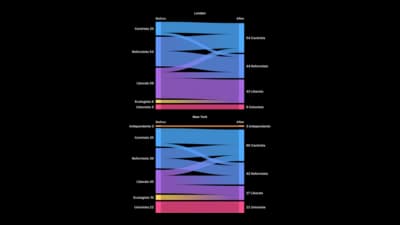
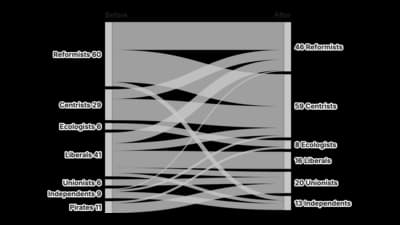
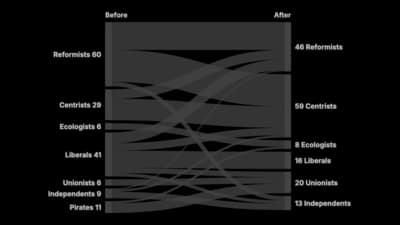
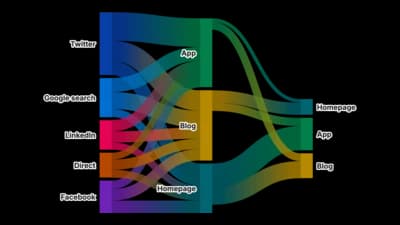
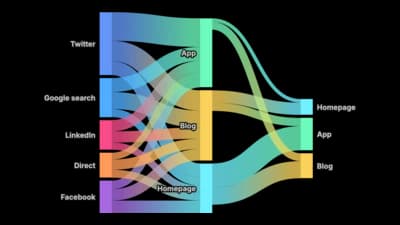
A Sankey diagram follows quantities as they move between stages or entities. The width of each band is the amount, so the reader sees where most of it goes and where it is lost. Alluvial diagrams show the same flows across several steps.
Where to use it
- Budgets and energy from source to use
- Customer journeys across steps
- Voter or student movement between groups
- Income and spending flows
Templates
Start from any of these templates and swap in your own data.
Ready to Transform Your Data Storytelling?
Join +6,000 creating stunning charts and video visuals with the all-in-one AI data visualization platform.
PlotSet helps data analysts, marketers, and designers transform complex data into clear, compelling stories. start creating today.