
Radar Chart
A web of axes that scores one item on several criteria.
The idea
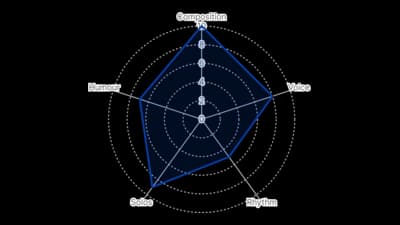
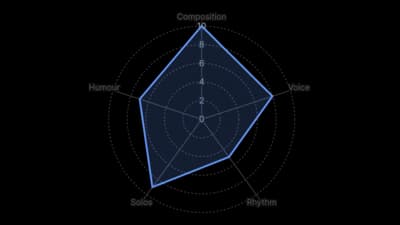
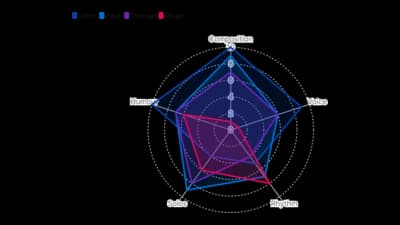
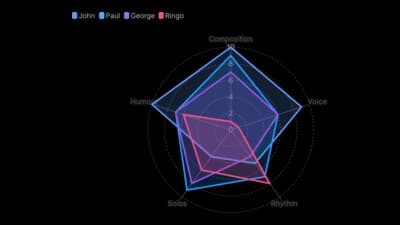
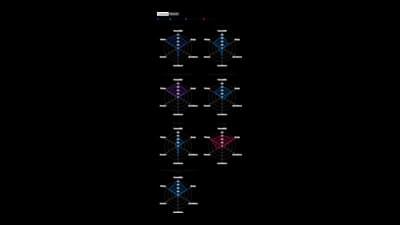
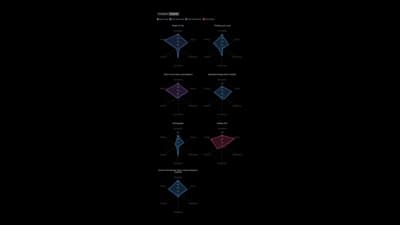
A radar chart draws one axis per criterion and joins the scores into a shape, so profiles can be compared at a glance. It is compact, but angles are harder to read than lengths, so keep it to a handful of axes and a few items.
Where to use it
- Scoring products or players on several criteria
- Skill and performance profiles
- Before and after profiles with comparison lines
- Compact dashboard tiles
Templates
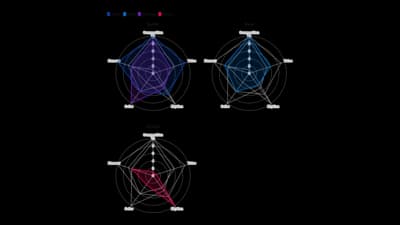
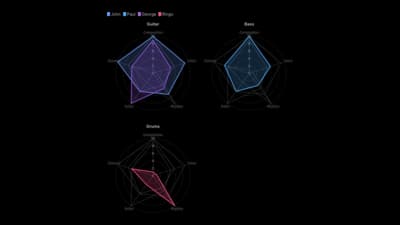
Start from any of these templates and swap in your own data.
Ready to Transform Your Data Storytelling?
Join +6,000 creating stunning charts and video visuals with the all-in-one AI data visualization platform.
PlotSet helps data analysts, marketers, and designers transform complex data into clear, compelling stories. start creating today.