
Chart Races
Animated bars, lines and rankings that show who leads, and when.
The idea
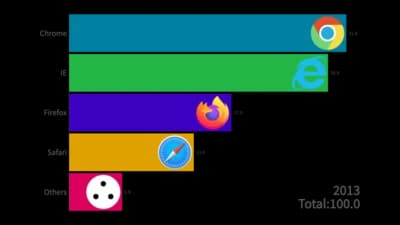
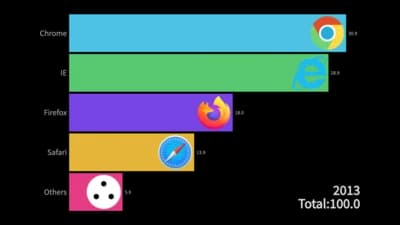
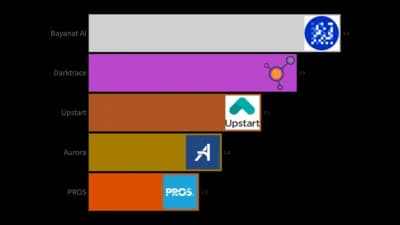
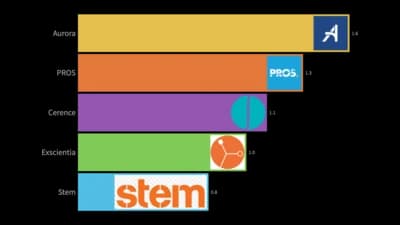
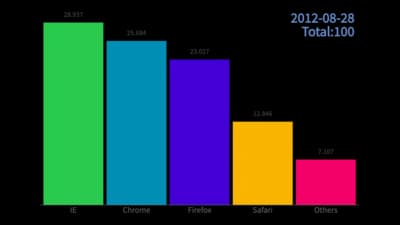
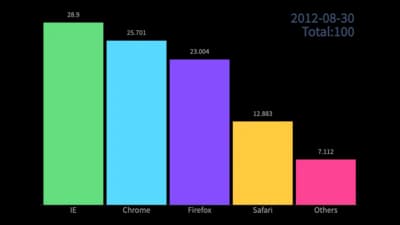
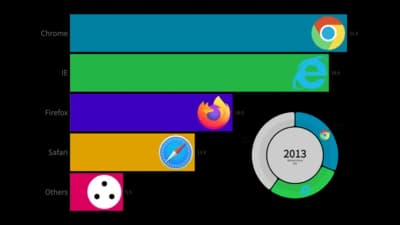
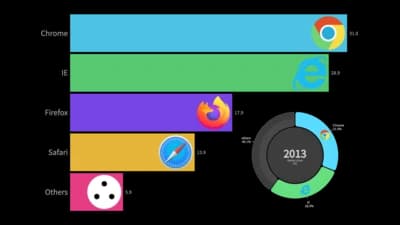
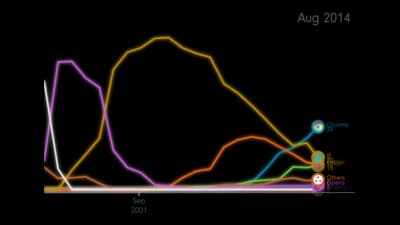
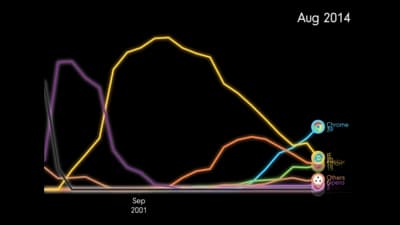
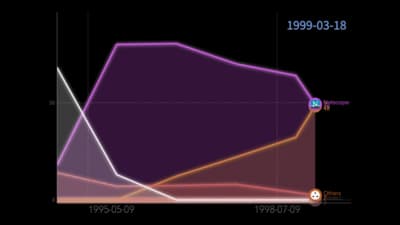
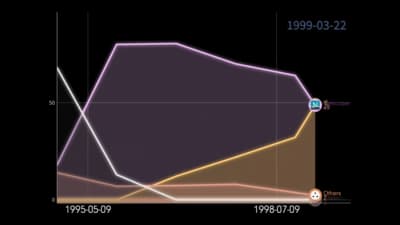
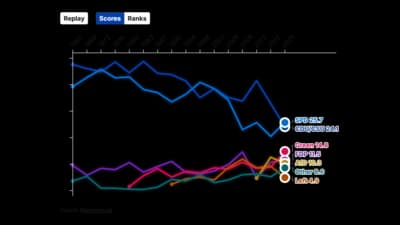
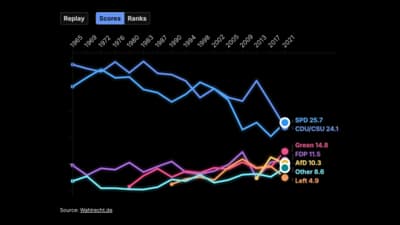
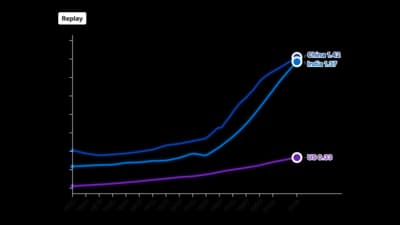
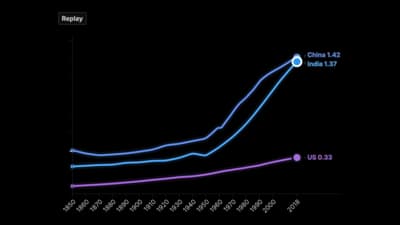
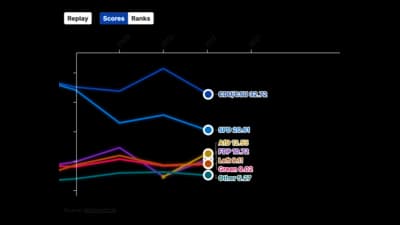
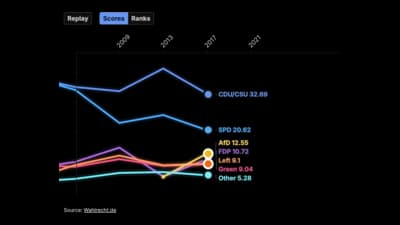
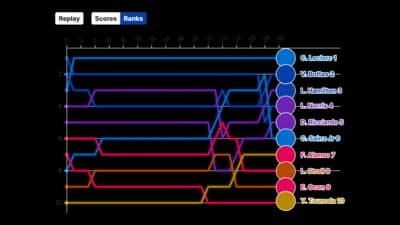
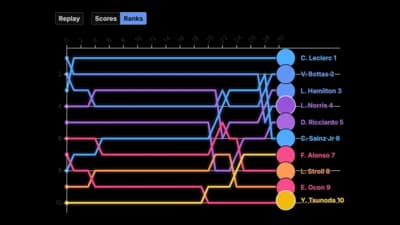
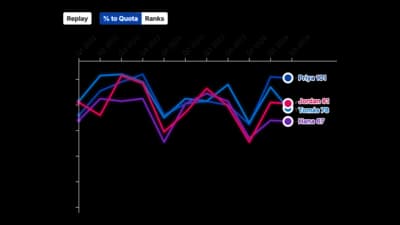
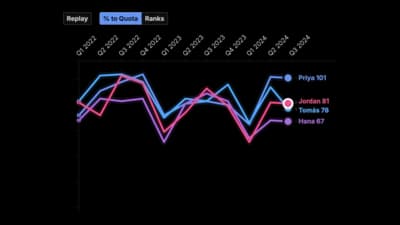
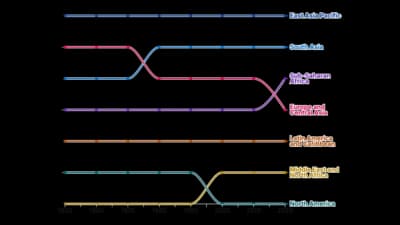
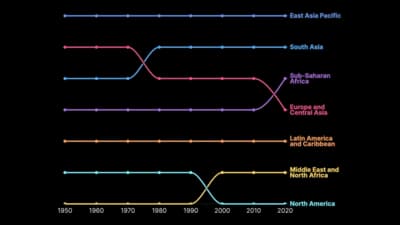
Race charts animate a ranking through time: bars reorder as values change, lines overtake each other and bump charts trace each item's rank. They turn a long table of years into a story people watch to the end. Keep the number of items modest so the leader changes stay readable.
Where to use it
- Company, brand or country rankings over decades
- Sports standings across a season
- Social-media and video-ready data stories
- Sales teams racing through the quarter
Templates
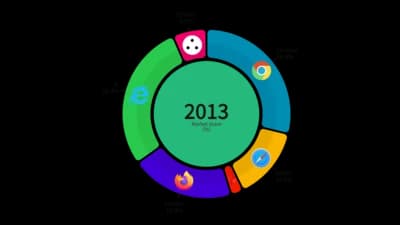
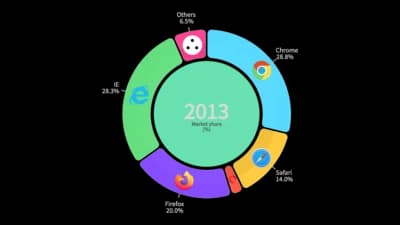
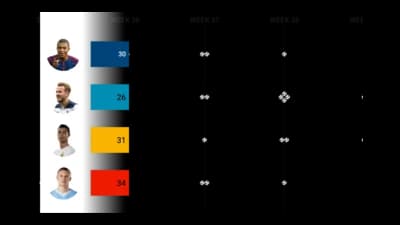
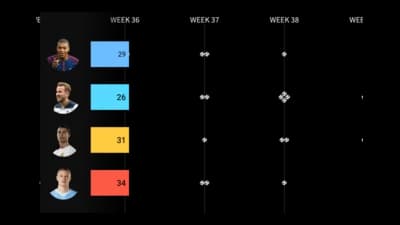
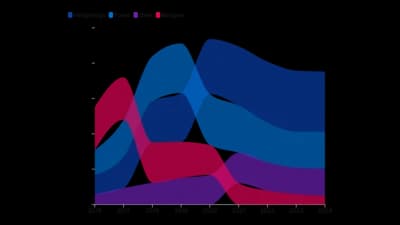
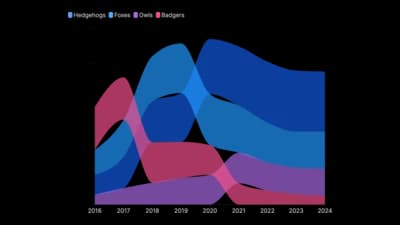
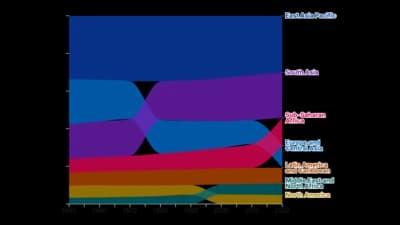
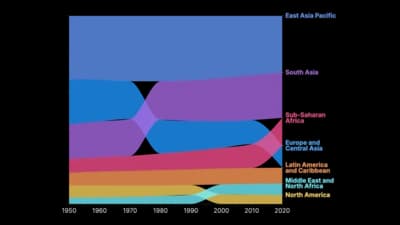
Start from any of these templates and swap in your own data.
Ready to Transform Your Data Storytelling?
Join +6,000 creating stunning charts and video visuals with the all-in-one AI data visualization platform.
PlotSet helps data analysts, marketers, and designers transform complex data into clear, compelling stories. start creating today.