
The idea
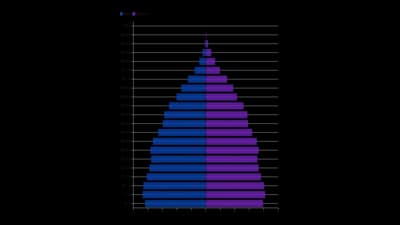
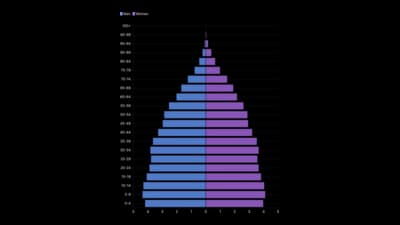
A population pyramid draws two sets of bars back to back along a shared axis, usually age groups for men and women. The shape tells the story of growth, ageing and migration. It works for any two groups split over the same categories.
Where to use it
- Population by age and gender
- Comparing a country over decades
- Customers or staff by age band
- Any two groups mirrored across categories
Templates
Start from any of these templates and swap in your own data.

Ready to Transform Your Data Storytelling?
Join +6,000 creating stunning charts and video visuals with the all-in-one AI data visualization platform.
PlotSet helps data analysts, marketers, and designers transform complex data into clear, compelling stories. start creating today.