
The idea
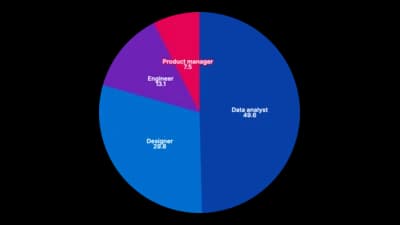
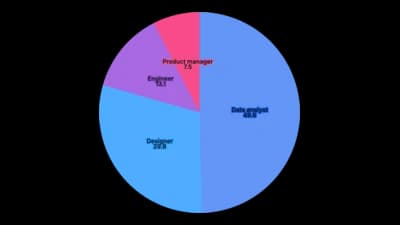
A pie chart splits a total into slices whose angle is the share each part takes. It works when the parts add up to a meaningful whole, such as a vote or a budget, and there are only a few. With many small slices, use a bar chart instead.
Where to use it
- Budget and spending shares
- Market share of a few competitors
- Survey answers as shares
- A simple split between two or three parts
Templates
Start from any of these templates and swap in your own data.
Ready to Transform Your Data Storytelling?
Join +6,000 creating stunning charts and video visuals with the all-in-one AI data visualization platform.
PlotSet helps data analysts, marketers, and designers transform complex data into clear, compelling stories. start creating today.