
The idea
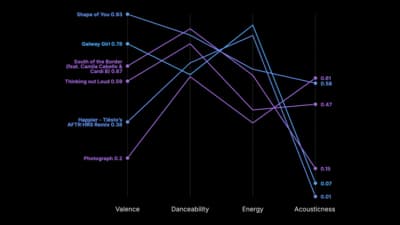
A parallel coordinates plot draws one axis per measure and one line per item, so you can compare items across many measures at once and spot clusters. It reads best with a modest number of lines. Highlight one item to follow it across the axes.
Where to use it
- Products or players scored on many criteria
- Comparing countries on several indicators
- Finding clusters in multi-measure data
- Following one item across several measures
Templates
Start from any of these templates and swap in your own data.
Ready to Transform Your Data Storytelling?
Join +6,000 creating stunning charts and video visuals with the all-in-one AI data visualization platform.
PlotSet helps data analysts, marketers, and designers transform complex data into clear, compelling stories. start creating today.