
Nightingale Rose Chart
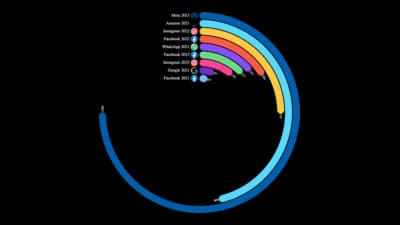
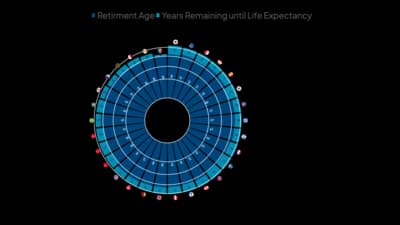
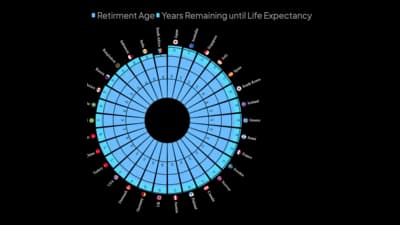
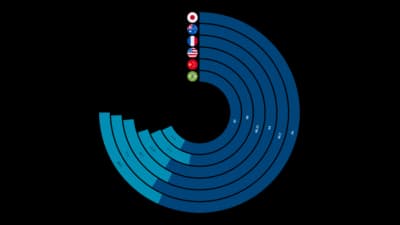
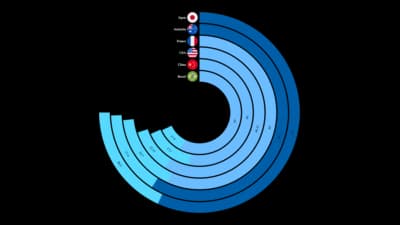
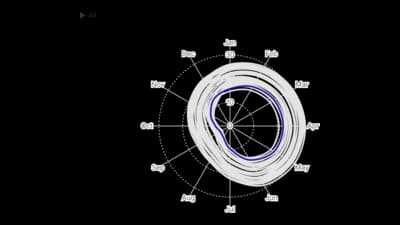
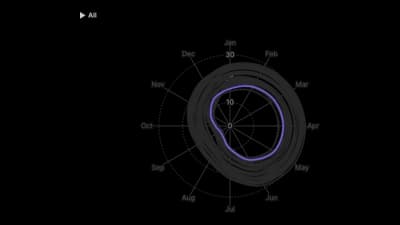
Wedges of equal angle and different radius, one per category or period.

The idea
A Nightingale rose gives each category an equal wedge and lets the radius carry the value, so it shows cycles such as months of the year at a glance. It is striking, but area grows with the square of the radius, so keep the values few and label them.
Where to use it
- Seasonal and monthly cycles
- Causes of change over a year
- Directions, such as wind or traffic
- Stacked wedges that split each category
Templates
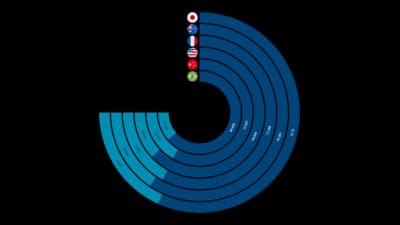
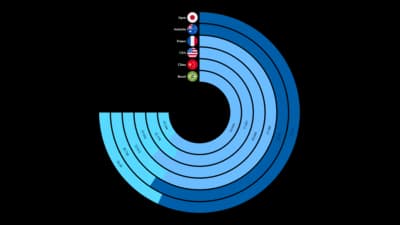
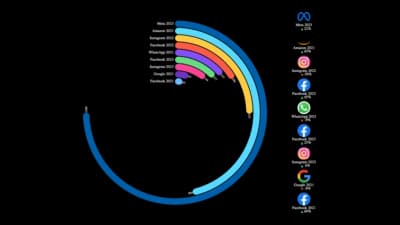
Start from any of these templates and swap in your own data.

Ready to Transform Your Data Storytelling?
Join +6,000 creating stunning charts and video visuals with the all-in-one AI data visualization platform.
PlotSet helps data analysts, marketers, and designers transform complex data into clear, compelling stories. start creating today.