
Marimekko Chart
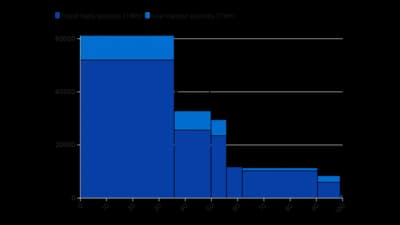
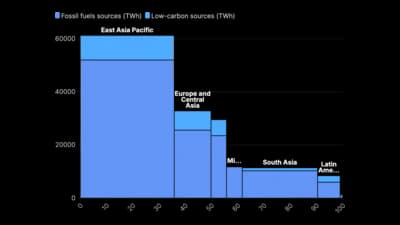
Stacked columns of variable width that show two dimensions at once.
The idea
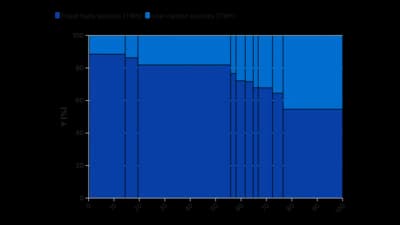
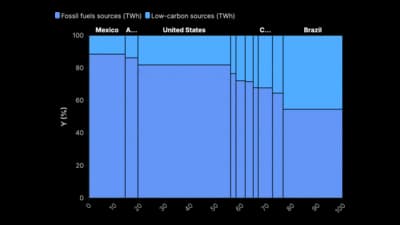
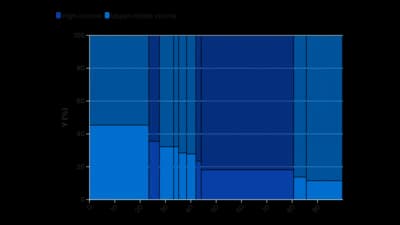
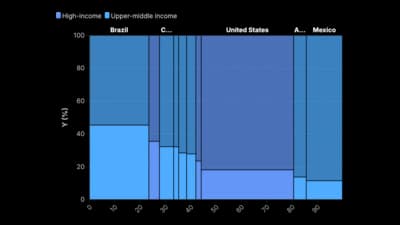
A Marimekko chart sizes each column by one measure and splits it by another, so you read market size and market share in a single picture. It is the classic tool for segment-by-segment breakdowns. Keep the segments few so the labels stay readable.
Where to use it
- Market share by region and company
- Revenue by segment and product line
- Budget split across departments
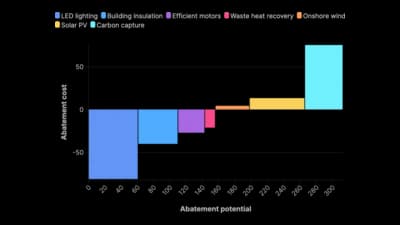
- Cost curves with variable widths
Templates
Start from any of these templates and swap in your own data.
Ready to Transform Your Data Storytelling?
Join +6,000 creating stunning charts and video visuals with the all-in-one AI data visualization platform.
PlotSet helps data analysts, marketers, and designers transform complex data into clear, compelling stories. start creating today.