
Line Graph
Lines that show how values change over time.
The idea
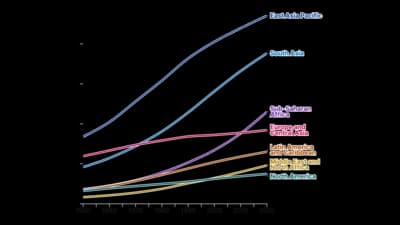
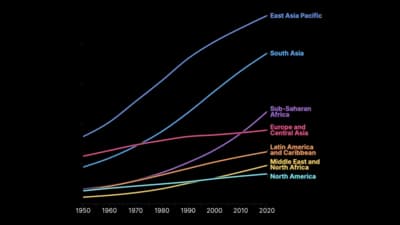
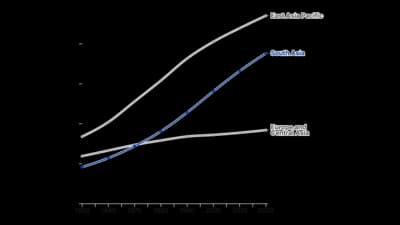
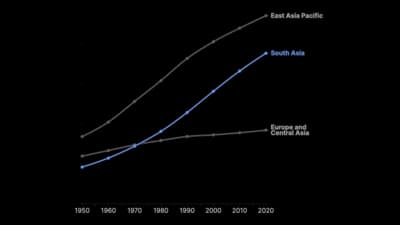
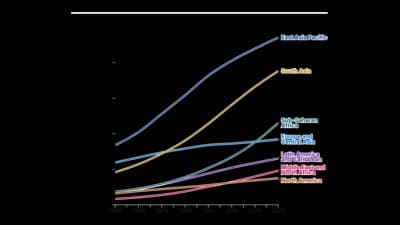
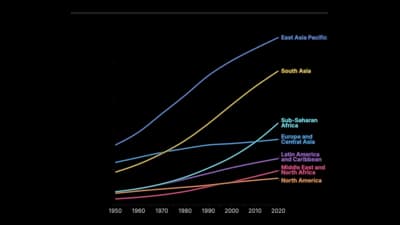
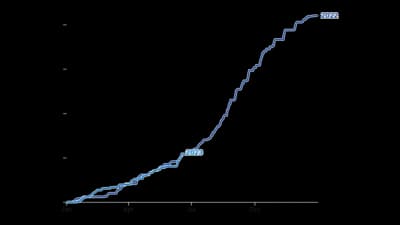
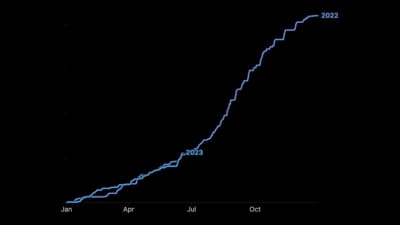
A line graph puts time on the horizontal axis and joins the points, so the shape of the change is the message: rises, falls, seasonality and turning points. Use it when the data is in time order and the reader cares about direction, not only the latest number.
Where to use it
- Sales, traffic and other metrics over months or years
- Prices, rates and indices
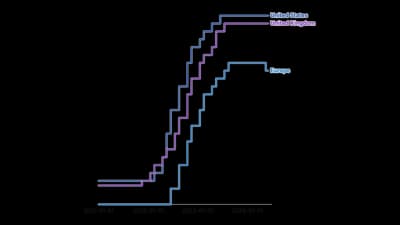
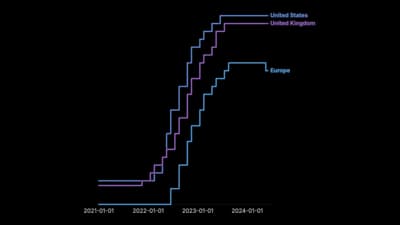
- Comparing a few series on the same time scale
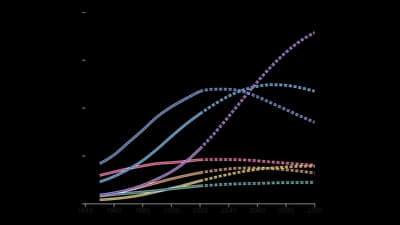
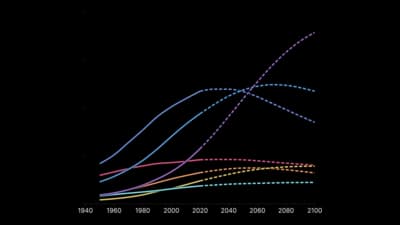
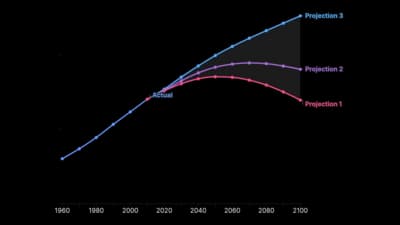
- Forecasts with a projected stretch or a fan
Templates
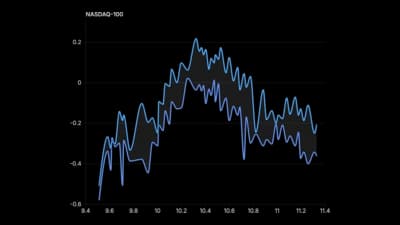
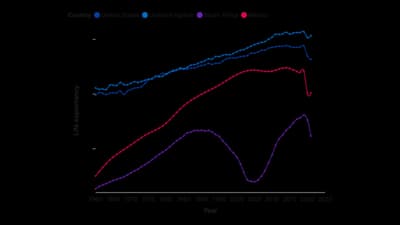
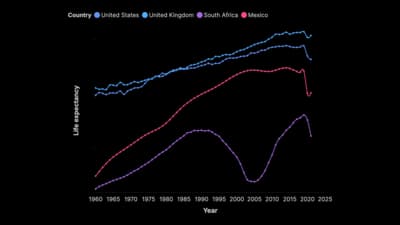
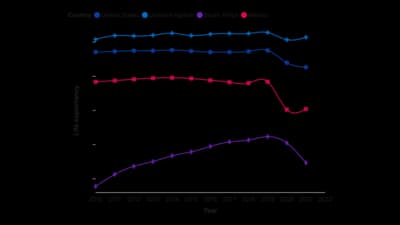
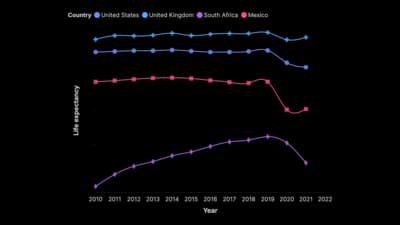
Start from any of these templates and swap in your own data.
Ready to Transform Your Data Storytelling?
Join +6,000 creating stunning charts and video visuals with the all-in-one AI data visualization platform.
PlotSet helps data analysts, marketers, and designers transform complex data into clear, compelling stories. start creating today.