
Histogram
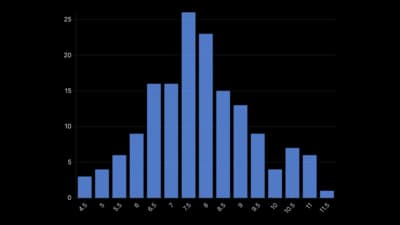
Bars that count how many values fall in each range.
The idea
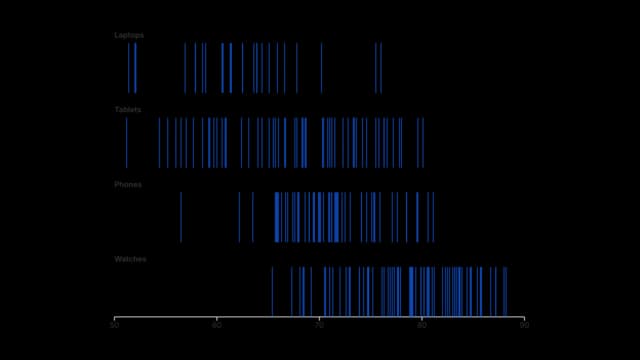
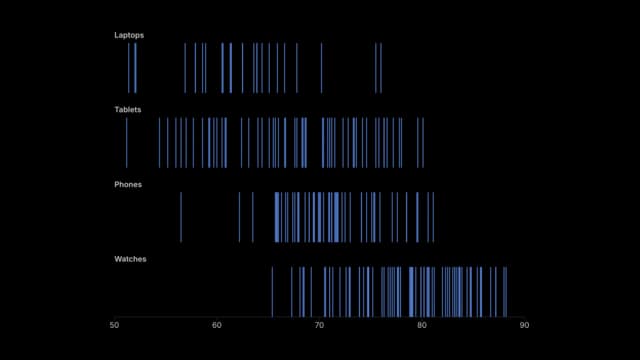
A histogram groups values into ranges and draws a bar for how many fall in each, so you see the shape of the data: its centre, spread, skew and gaps. The choice of bin width changes the look, so try a few. It is where to start with any new set of numbers.
Where to use it
- Ages, salaries and test scores
- Response times and wait times
- Finding gaps and outliers in data
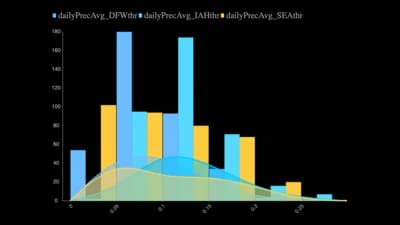
- A smooth curve laid over the bars
Templates
Start from any of these templates and swap in your own data.
Ready to Transform Your Data Storytelling?
Join +6,000 creating stunning charts and video visuals with the all-in-one AI data visualization platform.
PlotSet helps data analysts, marketers, and designers transform complex data into clear, compelling stories. start creating today.