
Heatmap
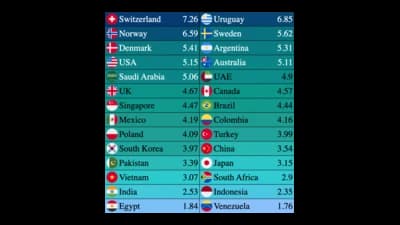
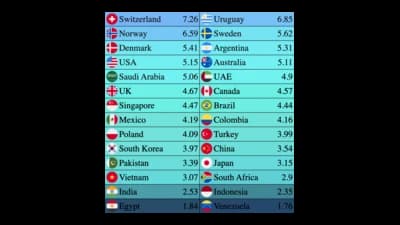
Colour-coded grids that make patterns in large tables visible.
The idea
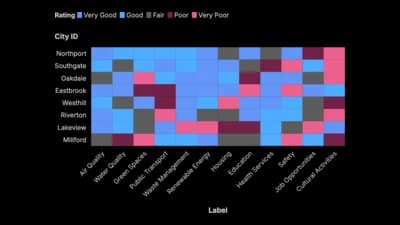
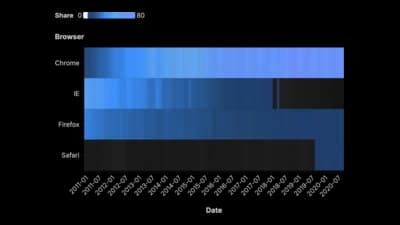
A heatmap turns every cell of a table into a colour, so hot spots and gaps stand out without reading a single number. Rows and columns can be categories, hours, days or cohorts. Use a sequential scale and keep the same order across every row.
Where to use it
- Activity by hour and weekday
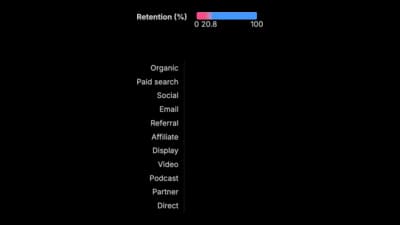
- Customer retention by sign-up cohort
- Daily values across a whole year
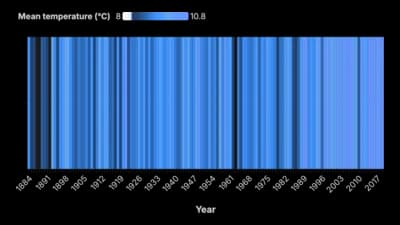
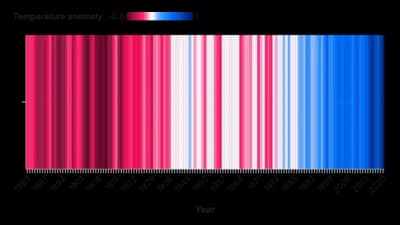
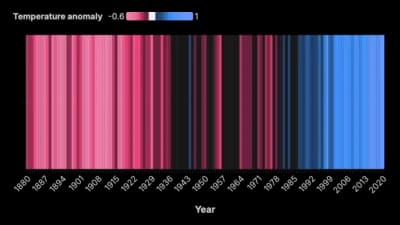
- Stripes that show a trend through colour
Templates
Start from any of these templates and swap in your own data.
Ready to Transform Your Data Storytelling?
Join +6,000 creating stunning charts and video visuals with the all-in-one AI data visualization platform.
PlotSet helps data analysts, marketers, and designers transform complex data into clear, compelling stories. start creating today.