
Gauge Chart
Dials and trackers that show progress toward a goal.
The idea
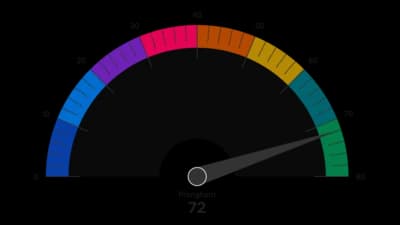
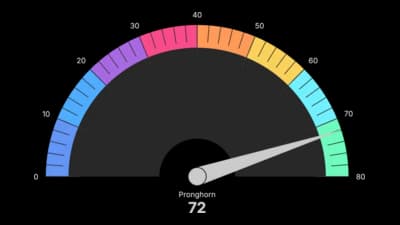
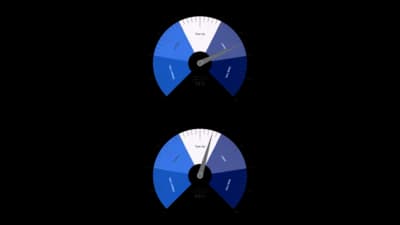
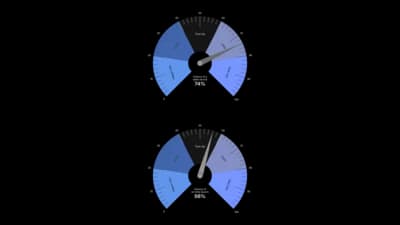
A gauge shows one value against a limit, like a speedometer, so the reader sees how close you are at once. Use it for a single headline number, since several gauges are hard to compare. Show the number itself in the middle.
Where to use it
- Progress toward a sales or fundraising goal
- Scores and ratings out of a maximum
- Dashboard tiles for one headline figure
- A grid of gauges, one per team or region
Templates
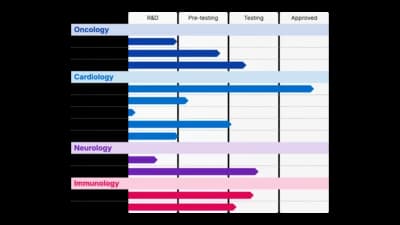
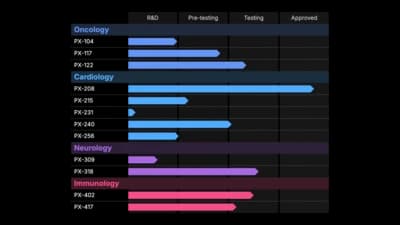
Start from any of these templates and swap in your own data.
Ready to Transform Your Data Storytelling?
Join +6,000 creating stunning charts and video visuals with the all-in-one AI data visualization platform.
PlotSet helps data analysts, marketers, and designers transform complex data into clear, compelling stories. start creating today.