
Gantt Chart
Tasks as bars along a schedule, from start to finish.
The idea
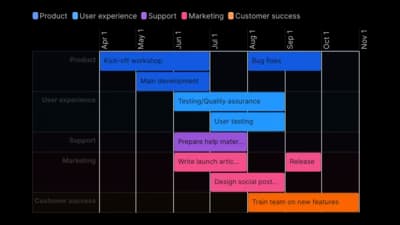
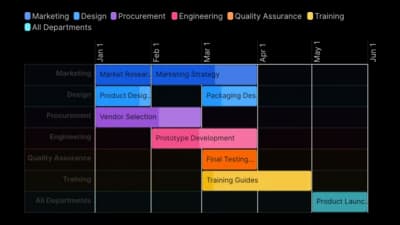
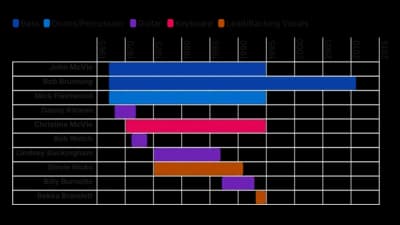
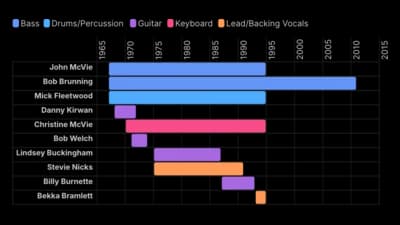
A Gantt chart lays tasks out as bars on a time axis, so start, duration and overlap are visible at once. Progress fills show how far each task has come. It is the standard view of a project plan and works for any schedule of phases.
Where to use it
- Project plans with tasks and phases
- Roadmaps and release schedules
- Progress against the planned dates
- Resource and team planning
Templates
Start from any of these templates and swap in your own data.
Ready to Transform Your Data Storytelling?
Join +6,000 creating stunning charts and video visuals with the all-in-one AI data visualization platform.
PlotSet helps data analysts, marketers, and designers transform complex data into clear, compelling stories. start creating today.