
The idea
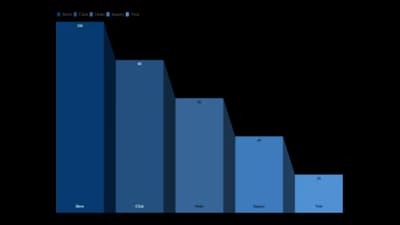
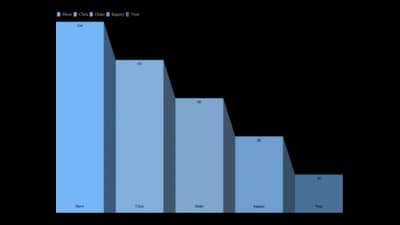
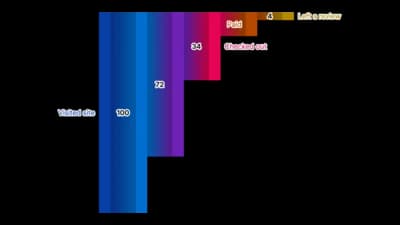
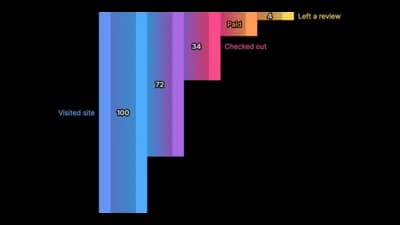
A funnel chart shows how a group shrinks from one stage to the next, so the biggest leak is easy to spot. It suits any process where each step loses some of the group before it. A Sankey version also shows where people go instead.
Where to use it
- Sign-up, checkout and onboarding conversion
- Sales pipeline from lead to closed deal
- Recruitment from applicant to hire
- Survey or application completion
Templates
Start from any of these templates and swap in your own data.
Ready to Transform Your Data Storytelling?
Join +6,000 creating stunning charts and video visuals with the all-in-one AI data visualization platform.
PlotSet helps data analysts, marketers, and designers transform complex data into clear, compelling stories. start creating today.