
The idea
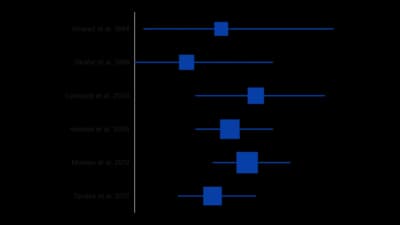
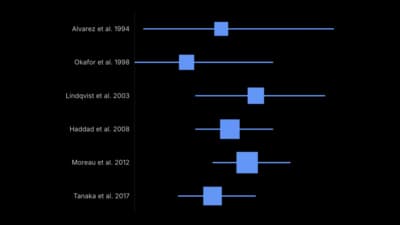
Error bars draw the uncertainty around each value, such as a confidence interval, so readers see how firm an estimate is. A forest plot lines up many estimates against a line of no effect. Say what the bar means, because it can be a range, an error or an interval.
Where to use it
- Confidence intervals from a survey
- Results of several studies in a forest plot
- Measurements with a margin of error
- Comparing estimates across groups
Templates
Start from any of these templates and swap in your own data.
Ready to Transform Your Data Storytelling?
Join +6,000 creating stunning charts and video visuals with the all-in-one AI data visualization platform.
PlotSet helps data analysts, marketers, and designers transform complex data into clear, compelling stories. start creating today.