
Dot Plot
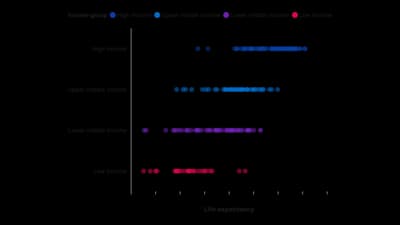
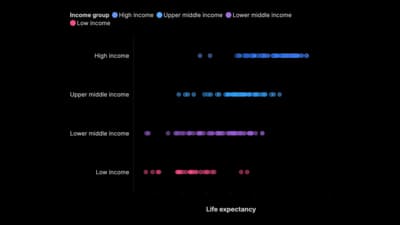
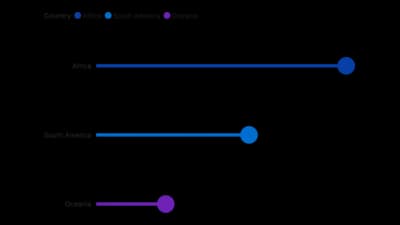
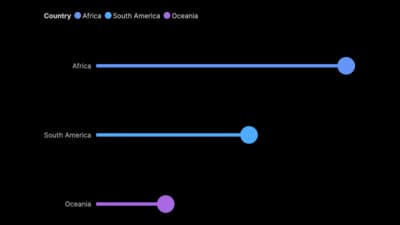
Dots and lollipops that show each value with little ink.
The idea
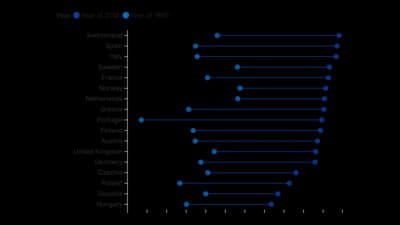
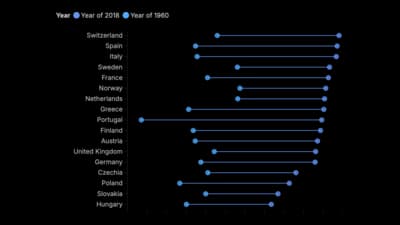
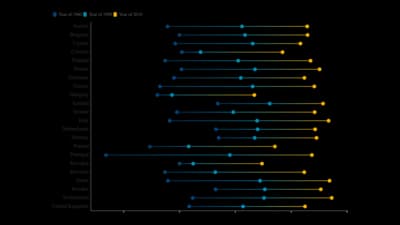
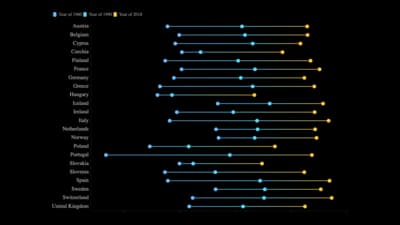
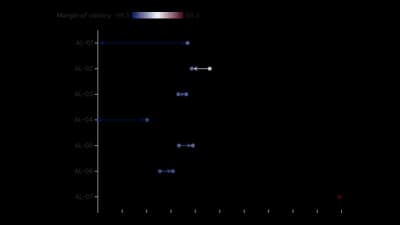
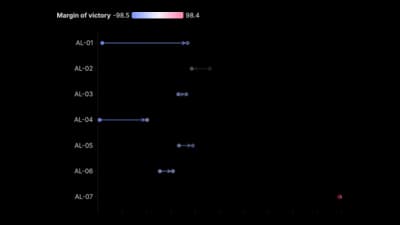
Dot plots, dumbbells and lollipops give the eye a clean position to compare, with far less ink than bars. Connect two dots to show a gap or a change between two points. They work well for many items and for values that do not start at zero.
Where to use it
- Before and after comparisons
- Gaps between two groups, such as men and women
- Long ranked lists of countries or companies
- Arrows that show change between two years
Templates
Start from any of these templates and swap in your own data.
Ready to Transform Your Data Storytelling?
Join +6,000 creating stunning charts and video visuals with the all-in-one AI data visualization platform.
PlotSet helps data analysts, marketers, and designers transform complex data into clear, compelling stories. start creating today.