
Dot Matrix Chart
Grids of dots or squares that make a share countable.
The idea
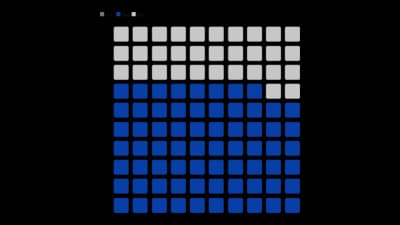
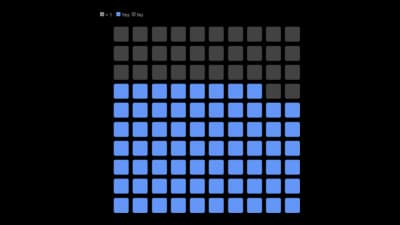
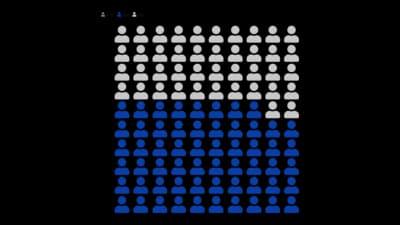
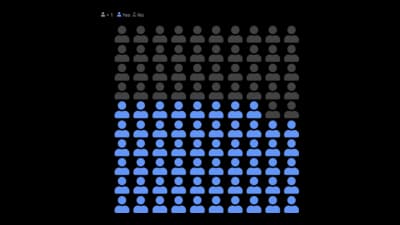
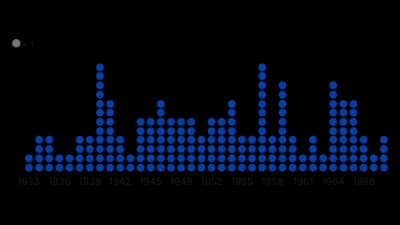
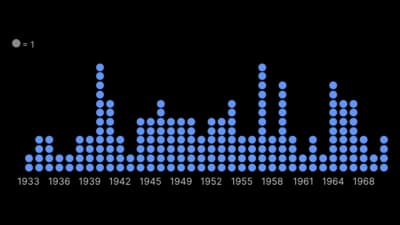
A dot matrix chart, or waffle chart, draws a share as filled dots in a grid, so 37% becomes 37 out of 100 you can count. It is easier to read than a pie for a single share. Keep every dot equal to one unit and say what it is.
Where to use it
- A share of a population as 100 squares
- People icons for human-scale numbers
- Stacked dots for counts by group
- Explaining statistics to a general audience
Templates
Start from any of these templates and swap in your own data.
Ready to Transform Your Data Storytelling?
Join +6,000 creating stunning charts and video visuals with the all-in-one AI data visualization platform.
PlotSet helps data analysts, marketers, and designers transform complex data into clear, compelling stories. start creating today.