
The idea
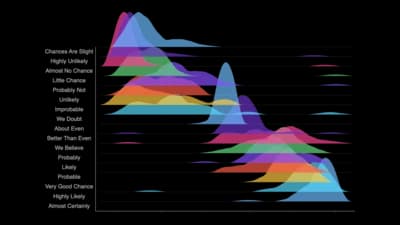
A density plot smooths a histogram into a curve, so the peaks, spread and skew of a distribution show without the choice of bins. Stacking several curves, as in a ridgeline, compares groups cleanly. Read the height as likelihood, not as a count.
Where to use it
- Distributions across years or groups
- Comparing many groups in a ridgeline
- Temperature, income or score distributions
- Showing where a group peaks
Templates
Start from any of these templates and swap in your own data.
Ready to Transform Your Data Storytelling?
Join +6,000 creating stunning charts and video visuals with the all-in-one AI data visualization platform.
PlotSet helps data analysts, marketers, and designers transform complex data into clear, compelling stories. start creating today.