
Density Map
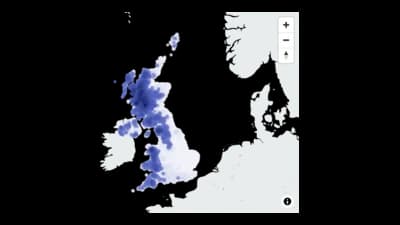
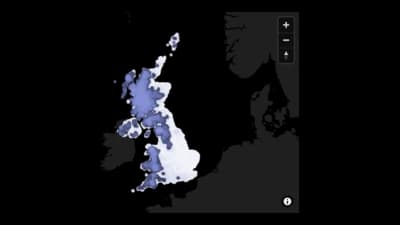
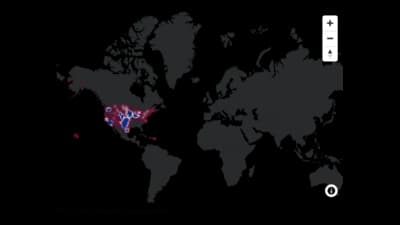
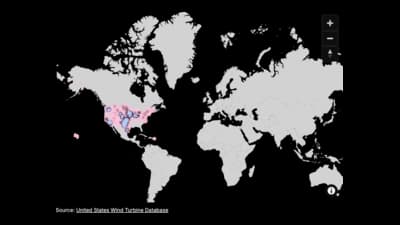
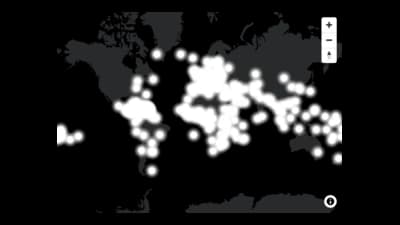
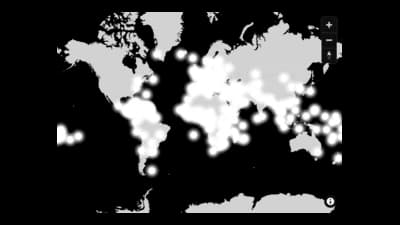
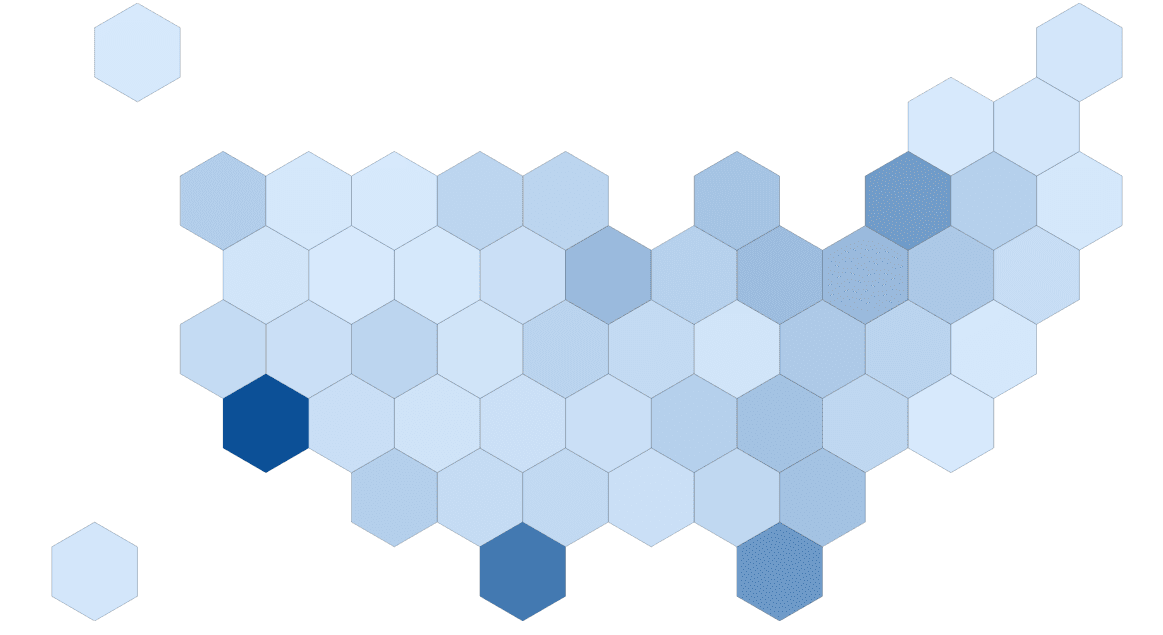
Heat and hexagons that show where points cluster on a map.
The idea
A density map turns many points into a smooth glow or a grid of hexagons, so you see where events cluster rather than every single dot. It stays readable when there are thousands of points. Say what one unit of heat stands for.
Where to use it
- Incidents, sales or visits across a city
- Hotspots of earthquakes or storms
- Event counts binned into hexagons
- Footfall and traffic patterns
Templates
Start from any of these templates and swap in your own data.
Ready to Transform Your Data Storytelling?
Join +6,000 creating stunning charts and video visuals with the all-in-one AI data visualization platform.
PlotSet helps data analysts, marketers, and designers transform complex data into clear, compelling stories. start creating today.