
The idea
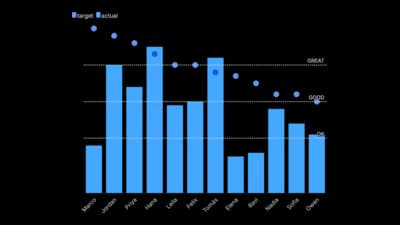
A bullet graph packs a result, a target and the ranges around them into one thin bar. It replaces a bulky gauge and lets you stack many measures in a small space. Colour the bands from poor to good and keep the target mark easy to see.
Where to use it
- Sales against quota
- KPIs on a dashboard
- Budget used against budget planned
- Scores against a benchmark
Templates
Start from any of these templates and swap in your own data.
Ready to Transform Your Data Storytelling?
Join +6,000 creating stunning charts and video visuals with the all-in-one AI data visualization platform.
PlotSet helps data analysts, marketers, and designers transform complex data into clear, compelling stories. start creating today.