
Bubble Chart
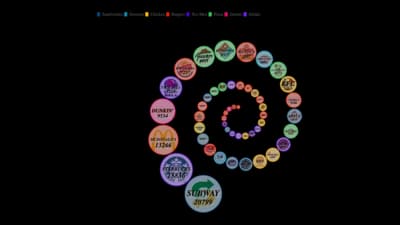
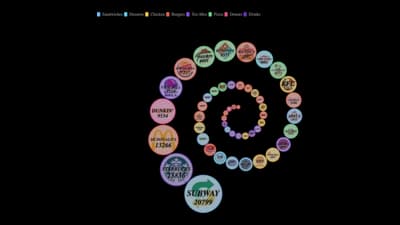
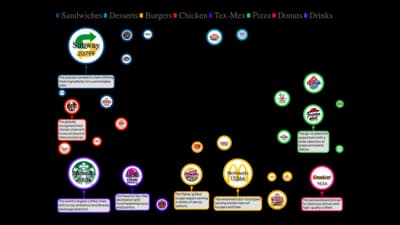
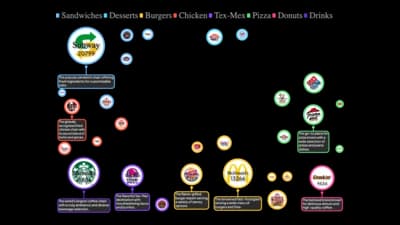
Circles sized by value, positioned or packed to compare many items.
The idea
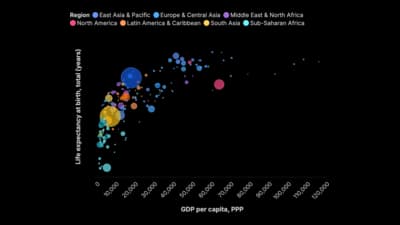
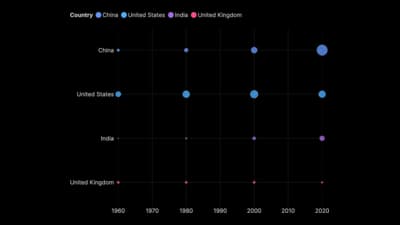
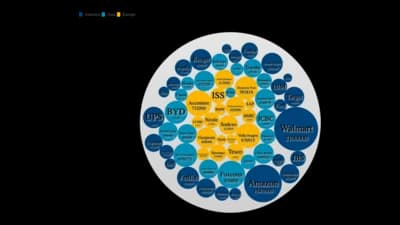
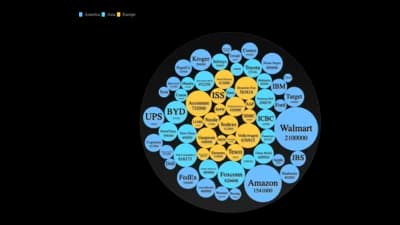
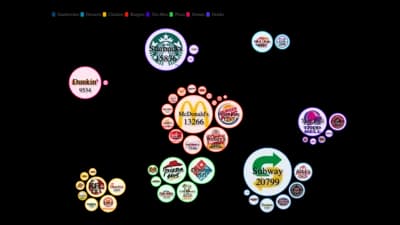
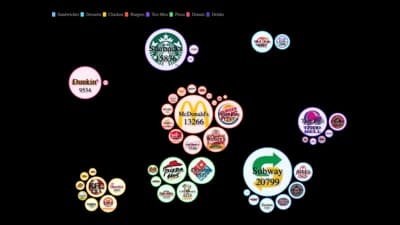
A bubble chart adds a third measure to a scatterplot: the size of the circle. Packed and force layouts drop the axes and let area do the comparing. It is friendly for audiences and good for showing a few big items among many small ones.
Where to use it
- Population or sales by country
- Three measures at once: x, y and size
- Proportional symbols on a plain canvas
- Eye-catching overviews of many categories
Templates
Start from any of these templates and swap in your own data.
Ready to Transform Your Data Storytelling?
Join +6,000 creating stunning charts and video visuals with the all-in-one AI data visualization platform.
PlotSet helps data analysts, marketers, and designers transform complex data into clear, compelling stories. start creating today.