
The idea
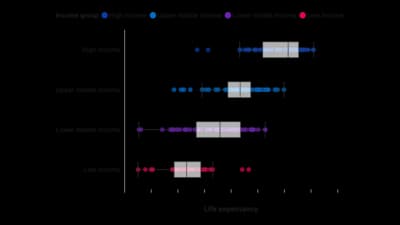
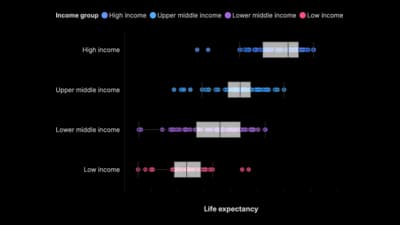
A box plot shows the median, the middle half of the values and the extremes in one compact shape. Several boxes side by side compare groups at a glance. It hides the shape of the distribution, so pair it with a histogram when that matters.
Where to use it
- Salaries or test scores across groups
- Response times and delivery times
- Spotting outliers before averaging
- Comparing the spread of a measure year by year
Templates
Start from any of these templates and swap in your own data.
Ready to Transform Your Data Storytelling?
Join +6,000 creating stunning charts and video visuals with the all-in-one AI data visualization platform.
PlotSet helps data analysts, marketers, and designers transform complex data into clear, compelling stories. start creating today.