
Area Graph
Filled lines that show how a quantity grows and shrinks over time.
The idea
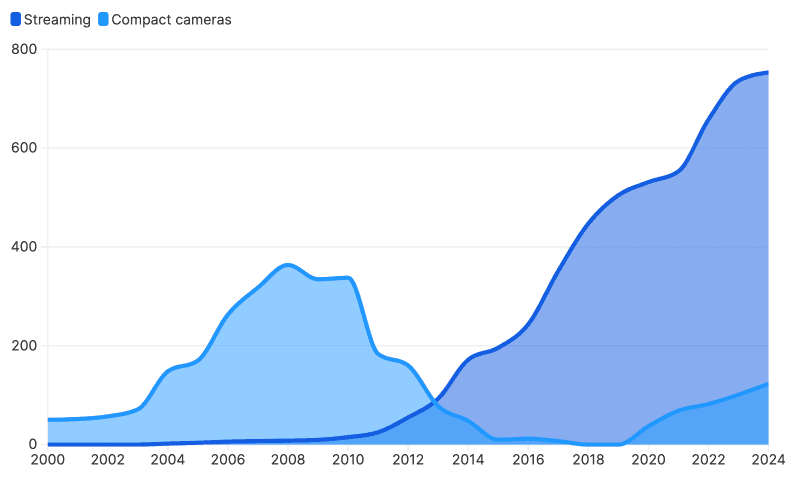
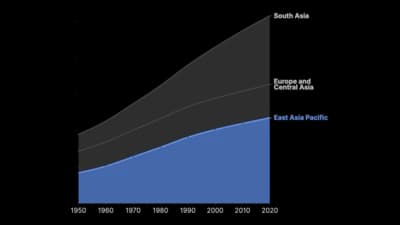
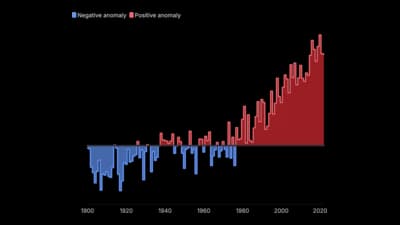
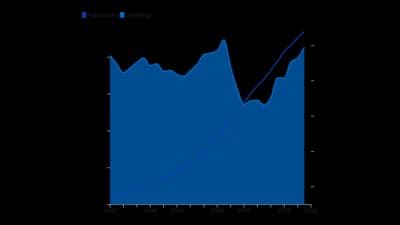
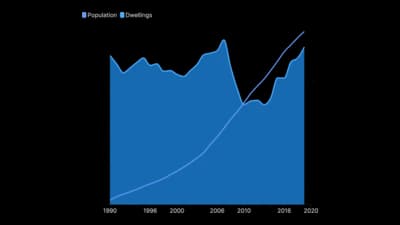
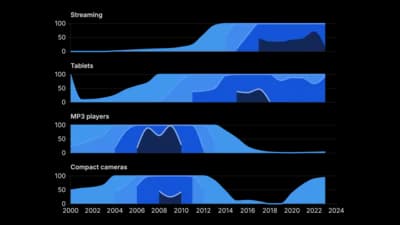
An area graph is a line chart with the space beneath it filled in, which gives the eye a sense of volume. Overlap several series with some transparency, or highlight one. Keep the baseline at zero, because the filled area exaggerates any other start.
Where to use it
- Traffic, sales or users over months
- A surplus and deficit around a baseline
- Comparing two or three overlapping series
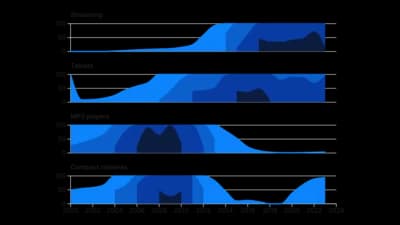
- Many small time series in a compact horizon chart
Templates
Start from any of these templates and swap in your own data.
Ready to Transform Your Data Storytelling?
Join +6,000 creating stunning charts and video visuals with the all-in-one AI data visualization platform.
PlotSet helps data analysts, marketers, and designers transform complex data into clear, compelling stories. start creating today.